
6.2: Real Gases


- Last updated
- Sep 10, 2020
- Save as PDF

( \newcommand{\kernel}{\mathrm{null}\,}\)
How well do real gases conform to the equation of state for an ideal gas? The answer is quite well over a large range of P, V and T, provided that the temperature is well above the critical temperature. We'll have to see shortly what is meant by the critical temperature; for the moment we'll say the ideal gas equation is followed quite well provided that the temperature is well above the temperature at which it can be liquefied merely by compressing it. Air at room temperature obeys the law quite well. Gases in stellar atmospheres also obey the law well, because there is no danger there of the gas liquefying. (In the cores of stars, however, where densities are very large, the gases obey a very different equation of state.)
One measure of how well the law is obeyed by real gases is to measure P, V and T, and see how close PVRT is to 1. The quantity RTPV is known as the compression factor, and is often given the symbol Z. For most real gases at very high pressures (a few hundred atmospheres), it is found in fact that Z is rather greater than 1. As the pressure is lowered, Z becomes lower, and then, alas, it overshoots and is found to be a little less than 1. Then at yet lower pressures Z rises again. The exact shape of the Z : P curve is different from gas to gas, as is the pressure at which Z is a minimum. Yet, for all gases, as the pressure approaches zero, PV/T approaches R exactly. For this reason R is sometimes called the Universal Gas Constant as well as the Ideal Gas Constant. In the limit of very low pressures, all gases behave very closely to the behaviour of an ideal gas. In Section 6.3 we shall be examining more closely how the compression factor varies with pressure.
Another way to look at how closely real gases obey the ideal gas equation is to plot P versus V for a number of different temperatures. That is, we draw a set of isotherms. For an ideal gas, these isotherms, PV = constant, are rectangular hyperbolas. So they are for real gases at high temperatures. At lower temperatures, departures from the ideal gas equation are marked. Typical isotherms are sketched in figure VI.1. Alas, my limited skills with this infernal computer in front of me allow me only to sketch these isotherms crudely by hand.
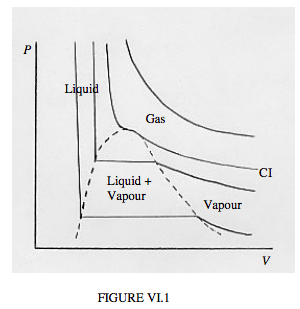
In the PV plane of figure VI.1, you will see several areas marked "gas", "liquid", "vapour", "liquid + vapour". You can follow the behaviour at a given temperature by starting at the right hand end of each isotherm, and gradually moving to the left – i.e. increase the pressure and decrease the volume. The hottest isotherm is nearly hyperboloidal. Nothing special happens beyond the volume decreasing as the pressure is increased, according to Boyle's law. At slightly lower temperatures, a kink develops in the isotherm, and at the critical temperature the kink develops a local horizontal inflection point. The isotherm for the critical temperature is the critical isotherm, marked CI on the sketch. Still nothing special happens other than V decreasing as P is increased, though not now according to Boyle's law.
For temperatures below the critical temperature, we refer to the gas as a vapour. As you decrease the volume, the pressure gradually increases until you reach the dashed curve. At this point, some of the vapour liquefies, and, as you continue to decrease the volume, more and more of the vapour liquefies, the pressure remaining constant while it does so. That’s the horizontal portion of the isotherm. In that region (i.e. outlined by the dashed curve) we have liquid and vapour in equilibrium. Near the right hand end of the horizontal portion, there is just a small amount of liquid; at the left hand end, most of the substance is liquid, with only a small amount of vapour left.
After it is all liquid, further increase of pressure barely decreases the volume, because the liquid is hardly at all compressible. The isotherm is then almost vertical.
The temperature of the critical isotherm is the critical temperature. The pressure and molar volume at the horizontal inflection point of the critical isotherm are the critical pressure and critical molar volume. The horizontal inflection point is the critical point.