
6.3: Van der Waals and Other Gases
- Page ID
- 7244

We have seen that real gases resemble an ideal gas only at low pressures and high temperatures. Various attempts have been made to find an equation that adequately represents the relation between P, V and T for a real gas – i.e. to find an Equation of State for a real gas. Some of these attempts have been purely empirical attempts to fit a mathematical formula to real data. Others are the result of at least an attempt to describe some physical model that would explain the behaviour of real gases. A sample of some of the simpler equations that have been proposed follows:
van der Waals' equation:
\[ \left( P + \frac{a}{V^2} \right) (V - b) = RT.\]
Berthelot's equation:
\[ \left( R + \frac{a}{ \left( TV^2 \right)} \right) (V - b) = RT.\]
Clausius's equation*:
\[ \left( P + \frac{a}{T(V+c)^2} \right) (V-b) = RT.\]
Dieterici's equation:
\[ P (V-b)e^{ \frac{a}{(RTV)}} = RT.\]
Redlich-Kwong:
\[ P = \frac{RT}{V-b} - \frac{a}{bT^{ \frac{1}{2}}} \left( \frac{1}{V} - \frac{1}{V + b} \right).\]
Virial equation:
\[ PV = A +BP + CP^2 + DP^3 + ...\]
*In Clausius’s equation, if we choose c = 3b, we get a fairly good agreement between the critical compression factor of a Clausius gas and of many real gases. The meaning of “critical compression factor”, and the calculation of its value for a Clausius gas is described a little later in this section.
There are many others, but by far the best known of these is van der Waals' equation, which I shall describe at some length.
It is not possible for the voice-box of an English speaker correctly to pronounce the name van der Waals, although the W is pronounced more like a V than a W, and, to my ear, the v is somewhat intermediate between a v and an f. To hear it correctly pronounced – especially the vowels − you must ask a native Dutch speaker. The frequent spelling "van der Waal's equation" is merely yet another symptom of the modern lamentable ignorance of the use of the apostrophe so much regretted by Lynne Truss.
The units in which the constants a and b should be expressed sometimes cause difficulty, and they depend on whether the symbol V in the equation is intended to mean the specific or molar volume. The following might be helpful.
If V is intended to mean the specific volume, van der Waals’ equation should be written \( \left( P + a/V^2 \right) (V-b) = RT/ \mu\), where µ is the molar mass (“molecular weight”). In this case the dimensions and SI units of a are M−1 L5 T−2 and Pa m6 kg−2 and the dimensions and SI units of b are M−1 L3 and m3 kg−1
If V is intended to mean the molar volume, van der Waals’ equation should be written in its familiar form \( \left( P + a/V^2 \right) (V-b) = RT\). In this case the dimensions and SI units of a are ML5T−2 mole−2 and Pa m6 kmole−2 and the dimensions and SI units of b are L3mole−1 and m3 kmole−1
The van der Waals constants, referred to molar volume, of H2O and CO2 are approximately:
H2O: a = 5.5 × 10⁵ Pa m6 kmole−2 . b = 3.1 × 10⁻² m3 kmole−1
CO2: a = 3.7 × 10⁵ Pa m6 kmole−2 b = 4.3 × 10⁻² m3 kmole−1
The van der Waals equation has its origin in at least some attempt to describe a physical model of a real gas. The properties of an ideal gas can be modelled by supposing that a gas consists of a collection of molecules of zero effective size and no forces between them, and pressure is the result of collisions with the walls of the containing vessel. In the van der Waals model, there are supposed to be attractive forces between the molecules. These are known as van der Waals forces and are now understood to arise because when one molecule approaches another, each induces a dipole moment in the other, and the two induced dipoles then attract each other. This attractive force reduces the pressure at the walls, the reduction being proportional to the number of molecules at the walls that are being attracted by the molecules beneath, and to the number of molecules beneath, which are doing the attracting. Both are inversely proportional to V, so the pressure in the equation of state has to be replaced by the measured pressure P plus a term that is inversely proportional to V2. Further, the molecules themselves occupy a finite volume. This is tantamount to saying that, at very close range, there are repulsive forces (now understood to be Coulomb forces) that are greater than the attractive van der Waals forces. Thus the volume in which the molecules are free to roam has to be reduced in the van der Waals equation. For more on the forces between molecules, see Section 6.8.
However convincing or otherwise you find these arguments, they are at least an attempt to describe some physics, they do represent the behaviour of real gases better that the ideal gas equation, and, if nothing else, they give us an opportunity for a little mathematics practice.
We shall see shortly how it is possible to determine the constants a and b from measurements of the critical parameters. These constants in turn give us some indication of the strength of the van der Waals forces, and of the size of the molecules.
Van der Waals' equation, equation 6.3.1, can be written
\[ P = \frac{RT}{V-b} - \frac{a}{V^2}.\]
A horizontal inflection point occurs where \( \frac{\partial P}{\partial V}\) and \( \frac{\partial ^2 P}{\partial V^2}\) are both zero. That is
\[ - \frac{RT}{(V-b)^2} + \frac{2a}{V^3} = 0\]
and
\[ \frac{2TR}{(V-b)^3} - \frac{6a}{V^4} = 0.\]
Eliminate RT/a from these to find the critical molar volume of a van der Waals gas:
\[ V_c = 3b.\]
Substitute this into equation 6.3.8 or 6.3.9 (or both, as a check on your algebra) to obtain the critical temperature:
\[ T_c = \frac{8a}{27Rb}.\]
Substitute equations 6.3.10 and 6.3.11 into equation 6.3.7 to obtain the critical pressure:
\[ P_c = \frac{a}{27b^2}.\]
From these, we readily obtain
\[ \frac{P_c V_c}{RT_c} = \frac{3}{8} = 0.375.\]
This quantity is often called the critical compression factor or critical compressibility factor, and we shall denote it by the symbol Zc. For many real gases Zc is about 0.28; thus the van der Waals equation, while useful in discussing the properties of gases in a qualitative fashion, does not reproduce the observed critical compression factor particularly well.
Let us now substitute \( p = P/P_c,~ v = V/V_c,~ t = T/T_c,\) and van der Waals' equation, in which the pressure, volume and temperature are expressed in terms of their critical values, becomes
\[ (p + 3/v^2)(v - \frac{1}{3} ) = \frac{8}{3} t.\]
This can also be written
\[ 3pv^3 -(p+8t)v^2+9v-3 =0.\]
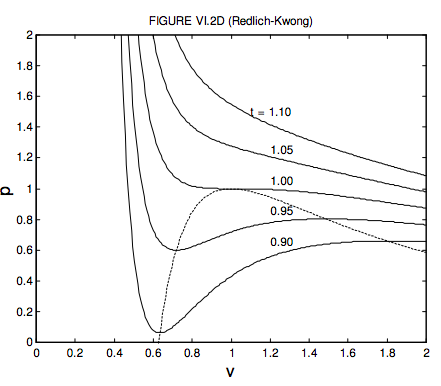
For volumes less than a third of the critical volume, this equation does not describe the behaviour of a real gas at all well. Indeed, you can see that p = ∞ when v = 1/3, which means that you have to exert an infinite pressure to compress a van der Waals gas to a third of its critical volume. You might want to investigate for yourself the behaviour of equations 6.3.14 and 15 for volumes smaller than this. You will find that it goes to infinity at v = 0 and 1/3, and it has a maximum between these two volumes. But the equation is of physical interest only for v > 1/3 , where the variation of pressure, volume and temperature bears at least some similarity to the behaviour of real gases, if by no means exact. In figure VI.2, I show the behaviour of a van der Waals gas for five temperatures – one above the critical temperature, one at the critical temperature, and three below the critical temperature. The locus of maxima and minima is found by eliminating t between equation 6.3.14 and ∂p/∂v = 0. You should try this, and show that the locus of the maxima and minima (which I have shown by a blue line in figure VI.2) is given by
\[ p = \frac{3}{v^2} - \frac{2}{v^3}\]
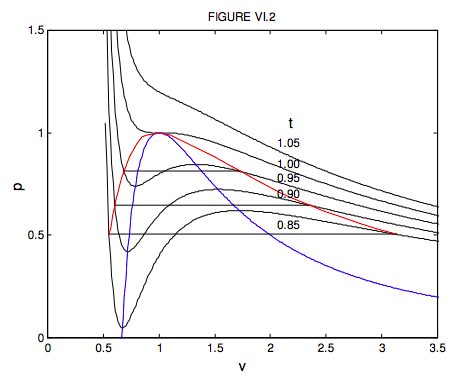
Don’t confuse the blue curve in this figure (it shows the locus of maxima and minima) with the dashed curve in figure VI.1 (it shows the boundary between phases.). For the temperatures 0.85, 0.90 and 0.95 I have drawn the constant pressure lines where liquid and vapour are in equilibrium in the real fluid. These are drawn so that they divide the van ver Waals curve into two equal areas, above and below. This means that the work done by the real fluid when it changes from liquid to vapour at constant pressure is equal to the work that would be done by its hypothetical van der Waals equivalent along its wiggly path. We shall later see that the placement of the horizontal line is a consequence of the fact that the Gibbs function (which we have not yet met) is constant while the liquid and vapour are in equilibrium. The dashed line of figure VI.1 would correspond on figure VI.2 to the locus of the ends of the horizontal lines. I have drawn this locus, which outlines the region where liquid and vapour are in equilibrium, in red in figure VI.2. While the van der Waals equation is only a rough approximation to the behaviour of real gases, it is nevertheless true that, if pressures, temperatures and molar volumes are expressed in terms of the critical pressures, temperatures and molar volumes, the actual equations of state of real gases are very similar. Two gases with the same values of p, v and t are said to be in corresponding states, and the observation that the p : v : t relation is approximately the same for all gases is called the Law of Corresponding States. We may think of gases as being composed of particles (molecules) and the only difference between different gases is in the sizes of their molecules (i.e. their different van der Waals b constants) and their dipole moments or their electrical polarizabilities (i.e. their different van der Waals a constants). In the dimensionless forms of the equation of state, these van der Waals constants are removed from the equations, and it is not surprising that all gases then conform to the same equation of state.
I leave it to the reader to show that, for a Berthelot gas, the critical molar volume, temperature and pressure and the critical compression factor are, respectively, 3b, \( \sqrt{\frac{8 a}{27 b R}}\), \( \frac{1}{b} \sqrt{\frac{a R}{216 b}}\) and 0.375, that the equation of state in terms of the dimensionless variables is
\[ p=\frac{8 t}{3 v-1}-\frac{3}{t v^{2}} ,\]
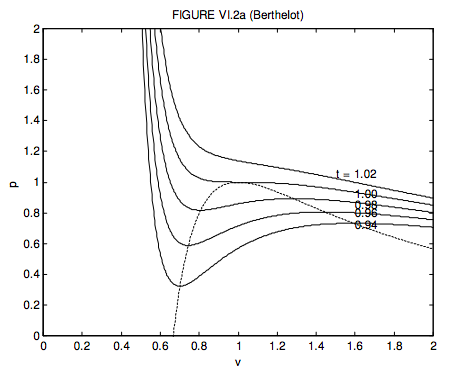
and that the locus of maxima and minima is
\[ p=\frac{1}{v^{1 / 2}}\left(\frac{4}{v}-\frac{6}{3 v-1}\right) .\]
These are shown in figure VI.2a. It will be noted that the critical compression factor is the same as (and hence no better than) for a van der Waals gas.
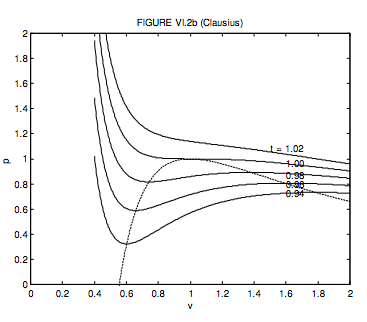
For a Clausius gas, the critical molar volume, temperature and pressure and the critical compression factor are, respectively, 3b + 2c, \( \sqrt{\frac{8 a}{27(b+c) R}}, \frac{1}{(b+c)} \sqrt{\frac{a R}{216(b+c)}}\) and \( \frac{3 b+2 c}{8(b+c)}\).
If c = 3b. these become 3c, \( \sqrt{\frac{2 a}{9 c R}}, \frac{1}{c} \sqrt{\frac{a R}{512 c}}\) and \( \frac{9}{32}=0.28125\). I choose c = 3b because that gives a good agreement with the critical compression factor for many real gases. In dimensionless units, the Clausius equation becomes
\[ p=\frac{32 t}{9 v-1}-\frac{48}{t(3 v+1)^{2}}\]
The locus of maxima and minima is
\[ p=\frac{1}{\sqrt{1+3 v}}\left(\frac{80-144 v}{1-6 v-27 v^{2}}\right)=\frac{16(5-9 v)}{(1-9 v)(1+3 v)^{3 / 2}}\]
These are shown in figure VI.2b
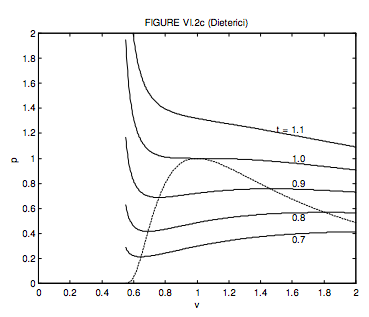
The Clausius equation was hard work. Dieterici’s is a little easier. The critical molar volume, temperature and pressure and the critical compression factor are, respectively, 2b, \( \frac{a}{4 R b}, \frac{a}{4 e^{2} b^{2}}\) and 2/e2 = 0.271. Note that the critical compression factor is much closer to that of many real gases. The dimensionless form of the Dieterici equation is
\[ p=\frac{t}{2 v-1} \exp \left(2-\frac{2}{t v}\right) .\]
The locus of maxima and minima is
\[ p=\frac{1}{v^{2}} \exp \left(\frac{2(v-1)}{2 v-1}\right) .\]
These are shown in figure VI.2c.
The Redlich-Kwong equation of state, like those of van der Waals, Bethelot and Dieterici, has just two parameters (a and b). All of them are not too bad at temperatures appreciably above the critical temperature, but, close to the critical temperature, the Redlich-Kwong empirical equation agrees a little better than the van der Waals equation does with what is observed for real gases. Obtaining the critical constants in terms of the parameters is done by exactly the same method as for the van der Waals and other equations, but requires perhaps a little more work and patience. The reader might like (or might not like) to try it. For the critical constants I get
\[ V_{\mathrm{c}}=x b,\]
\[ T_{\mathrm{c}}=y\left(\frac{a}{b R}\right)^{2 / 3} \]
and
\[ P_{c}=z\left(\frac{a^{2} R}{b^{5}}\right)^{1 / 3} ,\]
where
\[ x=3.847322100\]
\[ y=0.345039996\]
and
\[ z=0.029894386.\]
The critical compression factor is xz/y , which is exactly 1/3. This is not as close to the compression factor of many real gases as the Dieterici critical compression factor is.
We can invert these equations to obtain expressions for a and b in terms of the critical temperature and pressure (or temperature and volume, or pressure and volume). Thus
\[ a=u\left(\frac{R^{2} T_{c}^{5 / 2}}{P_{\mathrm{c}}}\right) \]
and
\[ b=w \frac{R T_{\mathrm{c}}}{P_{\mathrm{c}}} ,\]
where
\[ u=0.427480233\]
and
\[ w=0.086640350. \]
(You can also do this for the other equations of state, of course.)
In order to reproduce these results, you’ll have to do a little work to see where all the constants come from. It turns out that the value of the constant x is the positive real root of the equation
\[ x^{3}-3 x^{2}-3 x-1=0. \]
In the above analysis, I obtained all the constants from a numerical solution of equation 6.3.33, but the solution to this equation (and all subsequent constants) can also be written in surds. Thus, with \( f=\sqrt[3]{2}-1, \quad g=\sqrt[3]{4}-1, \quad h=\sqrt[3]{16}-1 \), the constants can be calculated from
\[ x=\frac{1}{f}, \quad y=g^{2}, \quad z=\frac{3-5 g}{g+h}, \quad u=\frac{1}{9 f} \text { and } w=\frac{1}{3} f. \]
If we now introduce the dimensionless variables \( p=P / P_{\mathrm{c}}, v=V N_{\mathrm{c}}, t=T / T_{\mathrm{c}}\), and substitute these and equations 6.3.23-25 into equation 6.3.6, we obtain the dimensionless Redlich-Kwong equation
\[ p=\frac{l t}{x v-1}-\frac{1}{m t^{1 / 2}}\left(\frac{1}{x v}-\frac{1}{x v+1}\right) ,\]
where
\[ l=y / z=11.54196631 \quad \text { and } \quad m=g z=0.017559994.\]
The dimensionless Redlich-Kwong equation is illustrated in figure VI.2d. I have not tried to find an explicit equation for the locus of maxima, but instead I calculated it numerically, illustrated by the dashed line in figure VI.2d.
Here is a summary of the results for the two-parameter equations of state:
\[ \begin{matrix} ~ & P_c & V_c & T_c & Z_c & a & b \\ \text{Van der Waals} & \frac{a}{27 b^{2}} & 3b & \frac{8 a}{27 R b} & \frac{3}{8} & \frac{27 R^{2} T_{\mathrm{c}}^{2}}{64 P_{\mathrm{c}}} & \frac{R T_{\mathrm{c}}}{8 P_{\mathrm{c}}} \\ \text{Berthelot} & \frac{1}{b} \sqrt{\frac{a R}{216 b}} & 3b & \sqrt{\frac{8 a}{27 b R}} & \frac{3}{8} & \frac{27 R^{2} T_{\mathrm{c}}^{3}}{64 P_{\mathrm{e}}} & \frac{R T_{\mathrm{c}}}{8 P_{\mathrm{c}}} \\ \text{Dieterici} & \frac{a}{4 e^{2} b^{2}} & 2b & \frac{a}{4 R b} & 2 e^{-2} & \frac{R T_{\mathrm{c}}}{e^{2} P_{\mathrm{c}}} & \frac{4 R^{2} T_{\mathrm{c}}^{2}}{e^{2} P_{\mathrm{c}}} \\ \text{Redlich-Kwong} & z\left(\frac{a^{2} R}{b^{5}}\right)^{1 / 3} & xb & y\left(\frac{a}{b R}\right)^{2 / 3} & \frac{1}{3} & u\left(\frac{R^{2} T_{c}^{5 / 2}}{P_{c}}\right) & w \frac{R T_{\mathrm{c}}}{P_{\mathrm{c}}} \\ ~ & z = 0.0299 & x = 3.85 & y = 0.345 & u = 0.427 & w = 0.0866 \end{matrix}\]
The reader can try to reproduce these (let me know (jtatum@uvic.ca) if you find any mistakes!) or at least (a useful exercise) verify their dimensions. We mentioned in Section 6.2 that a useful way of indicating how the behaviour of a real gas differs from that of an ideal gas is by plotting the compression factor \( Z=\frac{P V}{R T}\) versus pressure. As the pressure approaches zero, the compression factor approaches 1. This is because the molecules are then so far apart that there are no appreciable forces (attractive or repulsive) between them. As the pressure is increased from zero, the compression factor generally at first drops a little below 1, and then rises above 1 as the pressure is increased. It will be interesting to see how the compression factor is expected to vary with pressure for the various “theoretical” gases that we have been discussing. I’ll do it just for a van der Waals gas, and I’ll use the dimensionless form of van der Waals’ equation, which was first given as equation 6.3.14:
\[ \left(p+3 / v^{2}\right)\left(v-\frac{1}{3}\right)=\frac{8}{3} t.\]
The compression factor is \( Z=\frac{P V}{R T}\) and the critical compression factor is \( Z_{c}=\frac{P_{c} V_{c}}{R T_{c}}\). From this, we see that \( Z=\frac{p v}{t} Z_{c}\). For a van der Waals gas, \( Z_{c}=\frac{3}{8}\), so that \( Z=\frac{3 p v}{8 t}\). Unfortunately, in order to plot Z versus p for a given t, we have to be able to express v in terms of p, which means solving equation 6.3.37, which is a cubic equation in \( v\left[3 p v^{3}-(p+8 t) v^{2}+9 v-3=0\right]\). I have done this numerically, and I show the resulting graphs of Z versus p for several temperatures, in figure VI.2e. Notice that at p = 1 and t = 1, (i.e. at the critical point), the compression factor is 0.375. The Z versus p curves for real gases have the same general shape, but the precise agreement in numerical detail is not quite so good. Where Z > 1, the pressure is greater than that of an ideal gas, the b (repulsive) part of the van der Waals equation being more important than the a (attractive) part. Where Z < 1, the pressure is less than that of an ideal gas, the a (attractive) part of the van der Waals equation being more important than the b (repulsive) part. I haven’t investigated whether the other “theoretical” equations of state do appreciably better. Why not have a go yourself?!
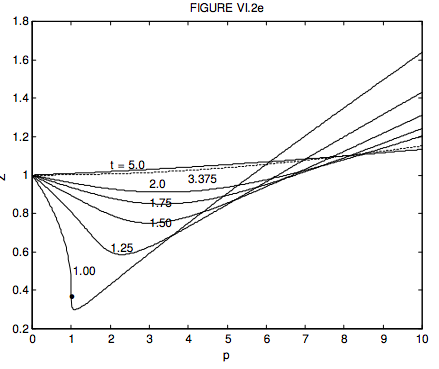
Figure VI.2e. The compression factor Z = PV / RT versus p (pressure in units of the critical pressure for a van der Waals gas, for several values of t (temperature in units of the critical temperature.) For a van der Waals gas the compression factor is greater than 1 for all temperatures greater than t = 27/8 = 3.375. At this temperature, the compression factor is close to 1 up to p equals approximately 2, and this temperature is known as the Boyle temperature. At the Boyle temperature, the Z : p curve is flat and close to 1 for a fairly large range of pressures. Thus, at the Boyle temperature, even a non-ideal gas obeys Boyle’s law fairly closely. For a van der Waals gas, the critical temperature is 8a/(27Rb), so the Boyle temperature for a van der Waals is a/(Rb). The reader should calculate this for H2O and CO2, using the values of the van der Waals constants given in this Chapter. The dot on the t = 1.00 isotherm at p = 1 and Z = 0.375 corresponds to the critical point. Anyone who feels in need of more mental exercise might like to ask: For what value of p (other than zero) is Z = 1. For example, can you show that, for t = 1, Z = 1 for p = 152/27 = 5.630?
The last proposed empirical equation of state that we mentioned is the virial equation, equation 6.3.6: \( P V=A+B P+C P^{2}+D P^{3}+\ldots \) This is sometimes written in the form \(P V=A+\frac{B}{V}+\frac{C}{V^{2}}+\frac{D}{V^{3}} \ldots \), but in these notes we’ll use the form of equation 6.3.6. The coefficients A, B, etc are called the virial coefficients and are functions of temperature. The first coefficient, A, is just RT. We can also write the virial equation as
\[ Z=1+B^{\prime} P+C^{\prime} P^{2}+D^{\prime} P^{3}+\ldots \]
We could measure the coefficient B' for a real gas by plotting Z as a function of pressure in a similar manner to figure VI.2e. The initial slope \( \left(\frac{\partial Z}{\partial P}\right)_{T} \) extrapolated to zero pressure gives the value of B'. At low temperatures B' is negative; at high temperatures B' is positive. At the Boyle temperature B' is zero, and at that temperature the compression factor is unity for a large range in pressures, and the gas accordingly closely conforms to Boyle’s law. The coefficient C' is small, so the term C'P2 comes into play only at higher pressures. At higher pressures, Z increases, showing that C' is a positive coefficient. The coefficient D' is smaller still than C'
All the mathematically “well-behaved” equations of state below the critical temperature have a maximum and a minimum – i.e. the curve shows a “wiggle”. I illustrate this in figure VI.2f. This is the van der Waals isotherm for t = 0.95 in dimensionless variables. It is the same as one of the curves shown in figure VI.2, drawn to a different scale so as to emphasize the “wiggle”.
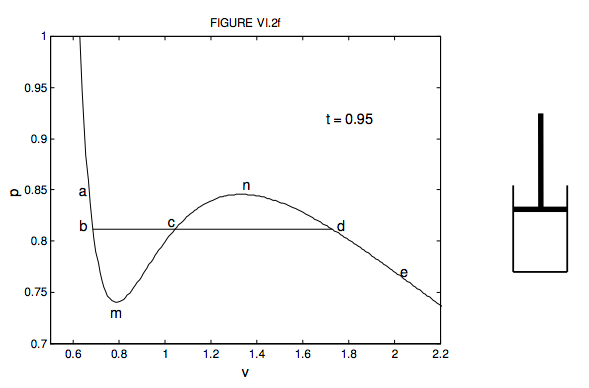
Using the little cylinder and piston to the right of the graph, try and imagine what happens to the enclosed liquid or vapour as you move the piston in and out at constant temperature, moving from a to e and back again on the graph. Start at e. The cylinder is filled with vapour. Move the piston inwards, going from e to d; the pressure increases and the volume decreases. Now a real gas doesn’t follow the van der Waals function all the way. At d, something different happens. Actually it is possible to take a vapour a little way past d towards (but not beyond) n. That would be a supercooled vapour, such as is used in a cloud chamber. It will condense immediately into a line of liquid droplets as soon as a charged particle flies through the vapour. However, what usually happens is that some of the vapour starts to condense as liquid, and we move horizontally from d to b. As we move the piston down at constant temperature, the volume of course decreases, and more and more liquid condenses in such a manner that the pressure remains constant. In the portion db, we have liquid and vapour existing together in the piston, in thermodynamic equilibrium. Near to the d end there is only a little liquid; near to the b end it is nearly all liquid, with only a little vapour left. Beyond b, towards a, the space is completely filled with liquid. We can push and push, increasing the pressure greatly, but there is very little change in volume, because the liquid is almost (though not quite) incompressible. The isotherm is very steep there. It is actually possible to take the liquid a little way from b towards (but not beyond) m without any of it vaporizing. This would be a superheated liquid, such as is used in a bubble chamber. It will vaporize immediately into a line of bubbles as soon as a charged particle flies through the liquid.
There will be further important material concerning change of state in Chapters 9 and 14. At present, though, I want to ask: At what pressure does condensation commence? Putting it another way, what is the height of the line bd in figure VI.2f? I have heard it argued that the height of bd, (the pressure at which condensation occurs) must be such that the area bmc is equal to the area cnd. I am not sure that I fully understand the arguments leading to this conclusion. After all, a real gas doesn’t conform exactly to a van der Waals equation or any of the other theoretical/empirical equations that we have discussed. But perhaps it is not unreasonable to draw bd such that the areas above and below it are equal, and in any case it makes for an interesting (and challenging) computational exercise. The van der Waals equation, in dimensionless variables, is given as equation 6.3.14. Can you calculate the pressure such that the area bmc below bd is equal to the area cnd above it? I make it p = 0.812, which is the height where I have drawn it in the figure. I haven’t done the calculation for the other equations. I leave that to you!