
3.A: The First Law of Thermodynamics (Answer)
- Page ID
- 10246

Check Your Understanding
3.1. \(\displaystyle p_2(V_2−V_1)\)
3.2. Line 1, \(\displaystyle ΔE_{int}=40J\);
line 2, \(\displaystyle W=50J\) and \(\displaystyle ΔE_{int}=40J\);
line 3, \(\displaystyle Q=80J\) and \(\displaystyle ΔE_{int}=40J\); and
line 4, \(\displaystyle Q=0\) and \(\displaystyle ΔE_{int}=40J\)
3.3. So that the process is represented by the curve \(\displaystyle p=nRT/V\) on the pV plot for the evaluation of work.
3.4. \(\displaystyle 1.26×10-^3J\).
Conceptual Questions
1. a. SE; b. ES; c. ES
3. Some of the energy goes into changing the phase of the liquid to gas.
5. Yes, as long as the work done equals the heat added there will be no change in internal energy and thereby no change in temperature. When water freezes or when ice melts while removing or adding heat, respectively, the temperature remains constant.
7. If more work is done on the system than heat added, the internal energy of the system will actually decrease.
9. The system must be in contact with a heat source that allows heat to flow into the system.
11. Isothermal processes must be slow to make sure that as heat is transferred, the temperature does not change. Even for isobaric and isochoric processes, the system must be in thermal equilibrium with slow changes of thermodynamic variables.
13. Typically \(\displaystyle C_p\) is greater than \(\displaystyle C_V\) because when expansion occurs under constant pressure, it does work on the surroundings. Therefore, heat can go into internal energy and work. Under constant volume, all heat goes into internal energy. In this example, water contracts upon heating, so if we add heat at constant pressure, work is done on the water by surroundings and therefore, \(\displaystyle C_p\) is less than \(\displaystyle C_V\).
15. No, it is always greater than 1.
17. An adiabatic process has a change in temperature but no heat flow. The isothermal process has no change in temperature but has heat flow.
Problems
19. \(\displaystyle p(V−b)=−c_T\) is the temperature scale desired and mirrors the ideal gas if under constant volume.
21. \(\displaystyle V−bpT+cT^2=0\)
23. 74 K
25. 1.4 times
27. pVln(4)
29. a. 160 J; b. –160 J
31. \(\displaystyle W=900J\)
33. \(\displaystyle 3.53×10^4J\)
35. a. 1:1;
b. 10:1
37. a. 600 J;
b. 0;
c. 500 J;
d. 200 J;
e. 800 J;
f. 500 J
39. 580 J
41. a. 600 J;
b. 600 J;
c. 800 J
43. a. 0;
b. 160 J;
c. –160 J
45. a. 150 J;
b. 700 J
47. No work is done and they reach the same common temperature.
49. 54,500 J
51. a. \(\displaystyle (p_1+3V^2_1)(V_2−V_1)−3V_1(V^2_2−V^2_1)+(V^3_2−V^3_1)\);
b. \(\displaystyle \frac{3}{2}(p_2V_2−p_1V_1)\);
c. the sum of parts (a) and (b); d. \(\displaystyle T_1=\frac{p_1V_1}{nR}\) and \(\displaystyle T_2=\frac{p_2V_2}{nR}\)
53. a.
b. \(\displaystyle W=4.39kJ,ΔE_{int}=−4.39kJ\)
55. a. 1660 J;
b. −2730 J;
c. It does not depend on the process.
57. a. 700 J;
b. 500 J
59. a. −3 400 J;
b. 3400 J enters the gas
61. 100 J
63. a. 370 J;
b. 100 J;
c. 500 J
65. 850 J
67. pressure decreased by 0.31 times the original pressure
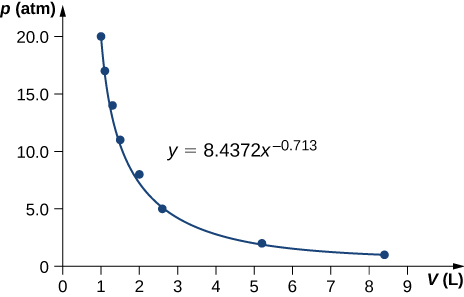
69. \(\displaystyle γ=0.713\)
71. 84 K
73. An adiabatic expansion has less work done and no heat flow, thereby a lower internal energy comparing to an isothermal expansion which has both heat flow and work done. Temperature decreases during adiabatic expansion.
75. Isothermal has a greater final pressure and does not depend on the type of gas.
77.
Additional Problems
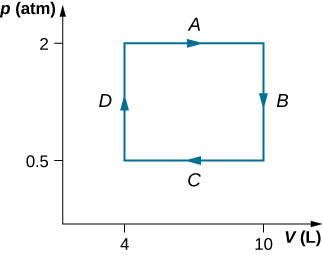
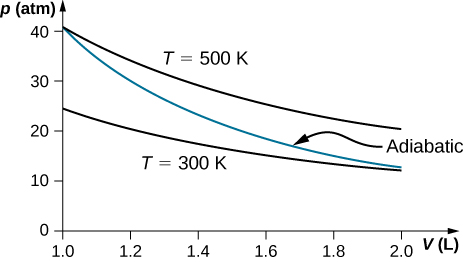
79. a. \(\displaystyle W_{AB}=0,W_{BC}=2026J,W_{AD}=810.4J,W_{DC}=0;\)
b. \(\displaystyle ΔE_{AB}=3600J,ΔE_{BC}=374J\);
c. \(\displaystyle ΔE_{AC}=3974J\);
d. \(\displaystyle Q_{ADC}=4784J\);
e. No, because heat was added for both parts AD and DC. There is not enough information to figure out how much is from each segment of the path.
81. 300 J
83. a. 59.5 J;
b. 170 N
85. \(\displaystyle 2.4×10^3J\)
87. a. 15,000 J;
b. 10,000 J;
c. 25,000 J
89. 78 J
91. A cylinder containing three moles of nitrogen gas is heated at a constant pressure of 2 atm. a. −1220 J; b. +1220 J
93. a. 7.6 L, 61.6 K;
b. 81.3 K;
c. \(\displaystyle 3.63L⋅atm=367J\);
d. −367 J
Challenge Problems
95. a. 1700 J; b. 1200 J; c. 2400 J
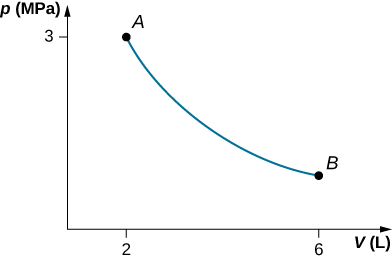
97. a. 2.2 mol;
b. \(\displaystyle V_A=6.7×10^{−2}m^3, V_B=3.3×10^{−2}m^3\);
c. \(\displaystyle T_A=2400K,T_B=397K\); d. 26,000 J
Contributors and Attributions
Samuel J. Ling (Truman State University), Jeff Sanny (Loyola Marymount University), and Bill Moebs with many contributing authors. This work is licensed by OpenStax University Physics under a Creative Commons Attribution License (by 4.0).