Physics LibreTexts

10.4: Elemental Data

  • Page ID
    29735
  • \( \newcommand{\vecs}[1]{\overset { \scriptstyle \rightharpoonup} {\mathbf{#1}} } \) \( \newcommand{\vecd}[1]{\overset{-\!-\!\rightharpoonup}{\vphantom{a}\smash {#1}}} \)\(\newcommand{\id}{\mathrm{id}}\) \( \newcommand{\Span}{\mathrm{span}}\) \( \newcommand{\kernel}{\mathrm{null}\,}\) \( \newcommand{\range}{\mathrm{range}\,}\) \( \newcommand{\RealPart}{\mathrm{Re}}\) \( \newcommand{\ImaginaryPart}{\mathrm{Im}}\) \( \newcommand{\Argument}{\mathrm{Arg}}\) \( \newcommand{\norm}[1]{\| #1 \|}\) \( \newcommand{\inner}[2]{\langle #1, #2 \rangle}\) \( \newcommand{\Span}{\mathrm{span}}\) \(\newcommand{\id}{\mathrm{id}}\) \( \newcommand{\Span}{\mathrm{span}}\) \( \newcommand{\kernel}{\mathrm{null}\,}\) \( \newcommand{\range}{\mathrm{range}\,}\) \( \newcommand{\RealPart}{\mathrm{Re}}\) \( \newcommand{\ImaginaryPart}{\mathrm{Im}}\) \( \newcommand{\Argument}{\mathrm{Arg}}\) \( \newcommand{\norm}[1]{\| #1 \|}\) \( \newcommand{\inner}[2]{\langle #1, #2 \rangle}\) \( \newcommand{\Span}{\mathrm{span}}\)\(\newcommand{\AA}{\unicode[.8,0]{x212B}}\)

    Elemental Data

    When you look at the spectrum of sunlight, you will see a blend of colors. This is called a continuous spectrum. This is like a rainbow, produced when sunlight passes through raindrops, which act as prisms.

    A rainbow is shown. Raindrops act as prisms, breaking the sunlight into its component colors.
    A rainbow. Raindrops act as prisms, breaking the sunlight into its component colors. Rainbow above Kaviskis Lake by Arz is licensed under CC BY-SA 3.0
    A continuous spectrum; the spectrum goes all the way from red to violet, with no gaps, is shown.
    A continuous spectrum. This is much like the rainbow. Spectral-lines-continuous by Stkl is in the Public Domain

    The science of spectroscopy starts in the lab, where scientists observe the spectra of different elements with the spectroscope. What scientists noted is that each element or compound have their own signature spectrum. So, when observing a star, astronomers use a spectroscope to definitively determine what elements make up that star, among other things about the star.

    Compare the spectra of hydrogen, helium. Oxygen, and neon, below. Look at the lines; this is the key to determine which element’s spectrum you are observing. Each spectrum is specific to that element. It is like fingerprints; no two are alike.

    The Hydrogen spectrum is shown, with no specific bright lines.
    Spectrum produced by Hydrogen, H Hydrogen spectrum visible by McZusatz is in the Public Domain, CC0
    The Helium spectrum is shown, with a bright yellow line evident.
    Spectrum produced by Helium, He Helium spectrum visible by McZusatz is in the Public Domain, CC0
    The Oxygen spectrum is shown, with over a dozen brighter colored lines evident.
    Spectrum produced by Oxygen, O Oxygen spectrum visible by McZusatz is in the Public Domain, CC0
    The Neon spectrum is shown, with many brighter colored lines evident.
    Spectrum produced by Neon, Ne Neon spectrum visible by McZusatz is in the Public Domain, CC0

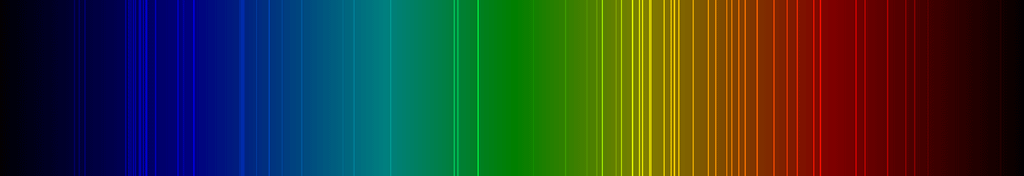
    When one captures the Sun’s spectra, it includes all of the elements and compounds found in the Sun.

    The “barcode of the Sun“ is shown. A very long spectrum was chopped in small chunks and then displayed one on top of another.
    The Sun’s Spectrum. This image tells astronomers a lot about our star, as spectra can about other stars. Included in the stellar spectral message is the star’s make-up and star type. The barcode of the Sun by ESO/José Francisco is licensed under CC BY 4.0

    Astronomers employ stellar spectroscopy to study stars, which allows them to determine many of the physical and chemical properties of the stars and other objects they study in space. (1)

    CC licensed content, Original

    10.4: Elemental Data is shared under a not declared license and was authored, remixed, and/or curated by LibreTexts.

    • Was this article helpful?