
1.2: Three-Phase Model of Pure Substances
- Page ID
- 17330

Pure Substances Have a Phase
We adopt the standard chemistry definition that a pure substance is any material with a definite chemical composition. By “pure”, we simply mean that only one chemical substance is present in the sample. So, water has a definite phase, but mixtures do not. This is partly a disclaimer so that questions such as "is glass a liquid or a solid?" can be put out of mind for now. For the first pass at this model, we treat pure substances as though they are in one of three phases: solid, liquid, or gas.
We are choosing which relevant features to include in our model and which to exclude. The choices will definitely affect the level of detail we can address in our questions and discuss in our explanations. At this time, we are deliberately choosing to be more general to keep the model as simple as possible and at the same time, applicable to as wide a range of phenomena as possible.
Graphical Representation of the Three-Phase Model
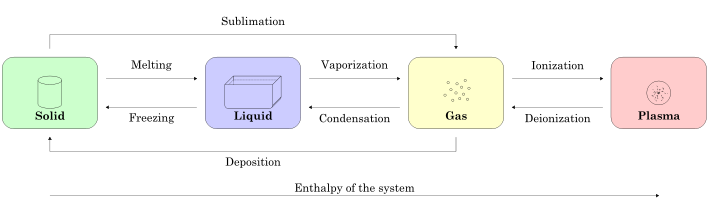
Figure 1.1.1 summarizes phases of matter and terminology of various phase transitions. In the Three-Phase Model, we will only focus on the solid, liquid, and gas phases.
Figure 1.1.1 – Summary of Possible Phase Transitions
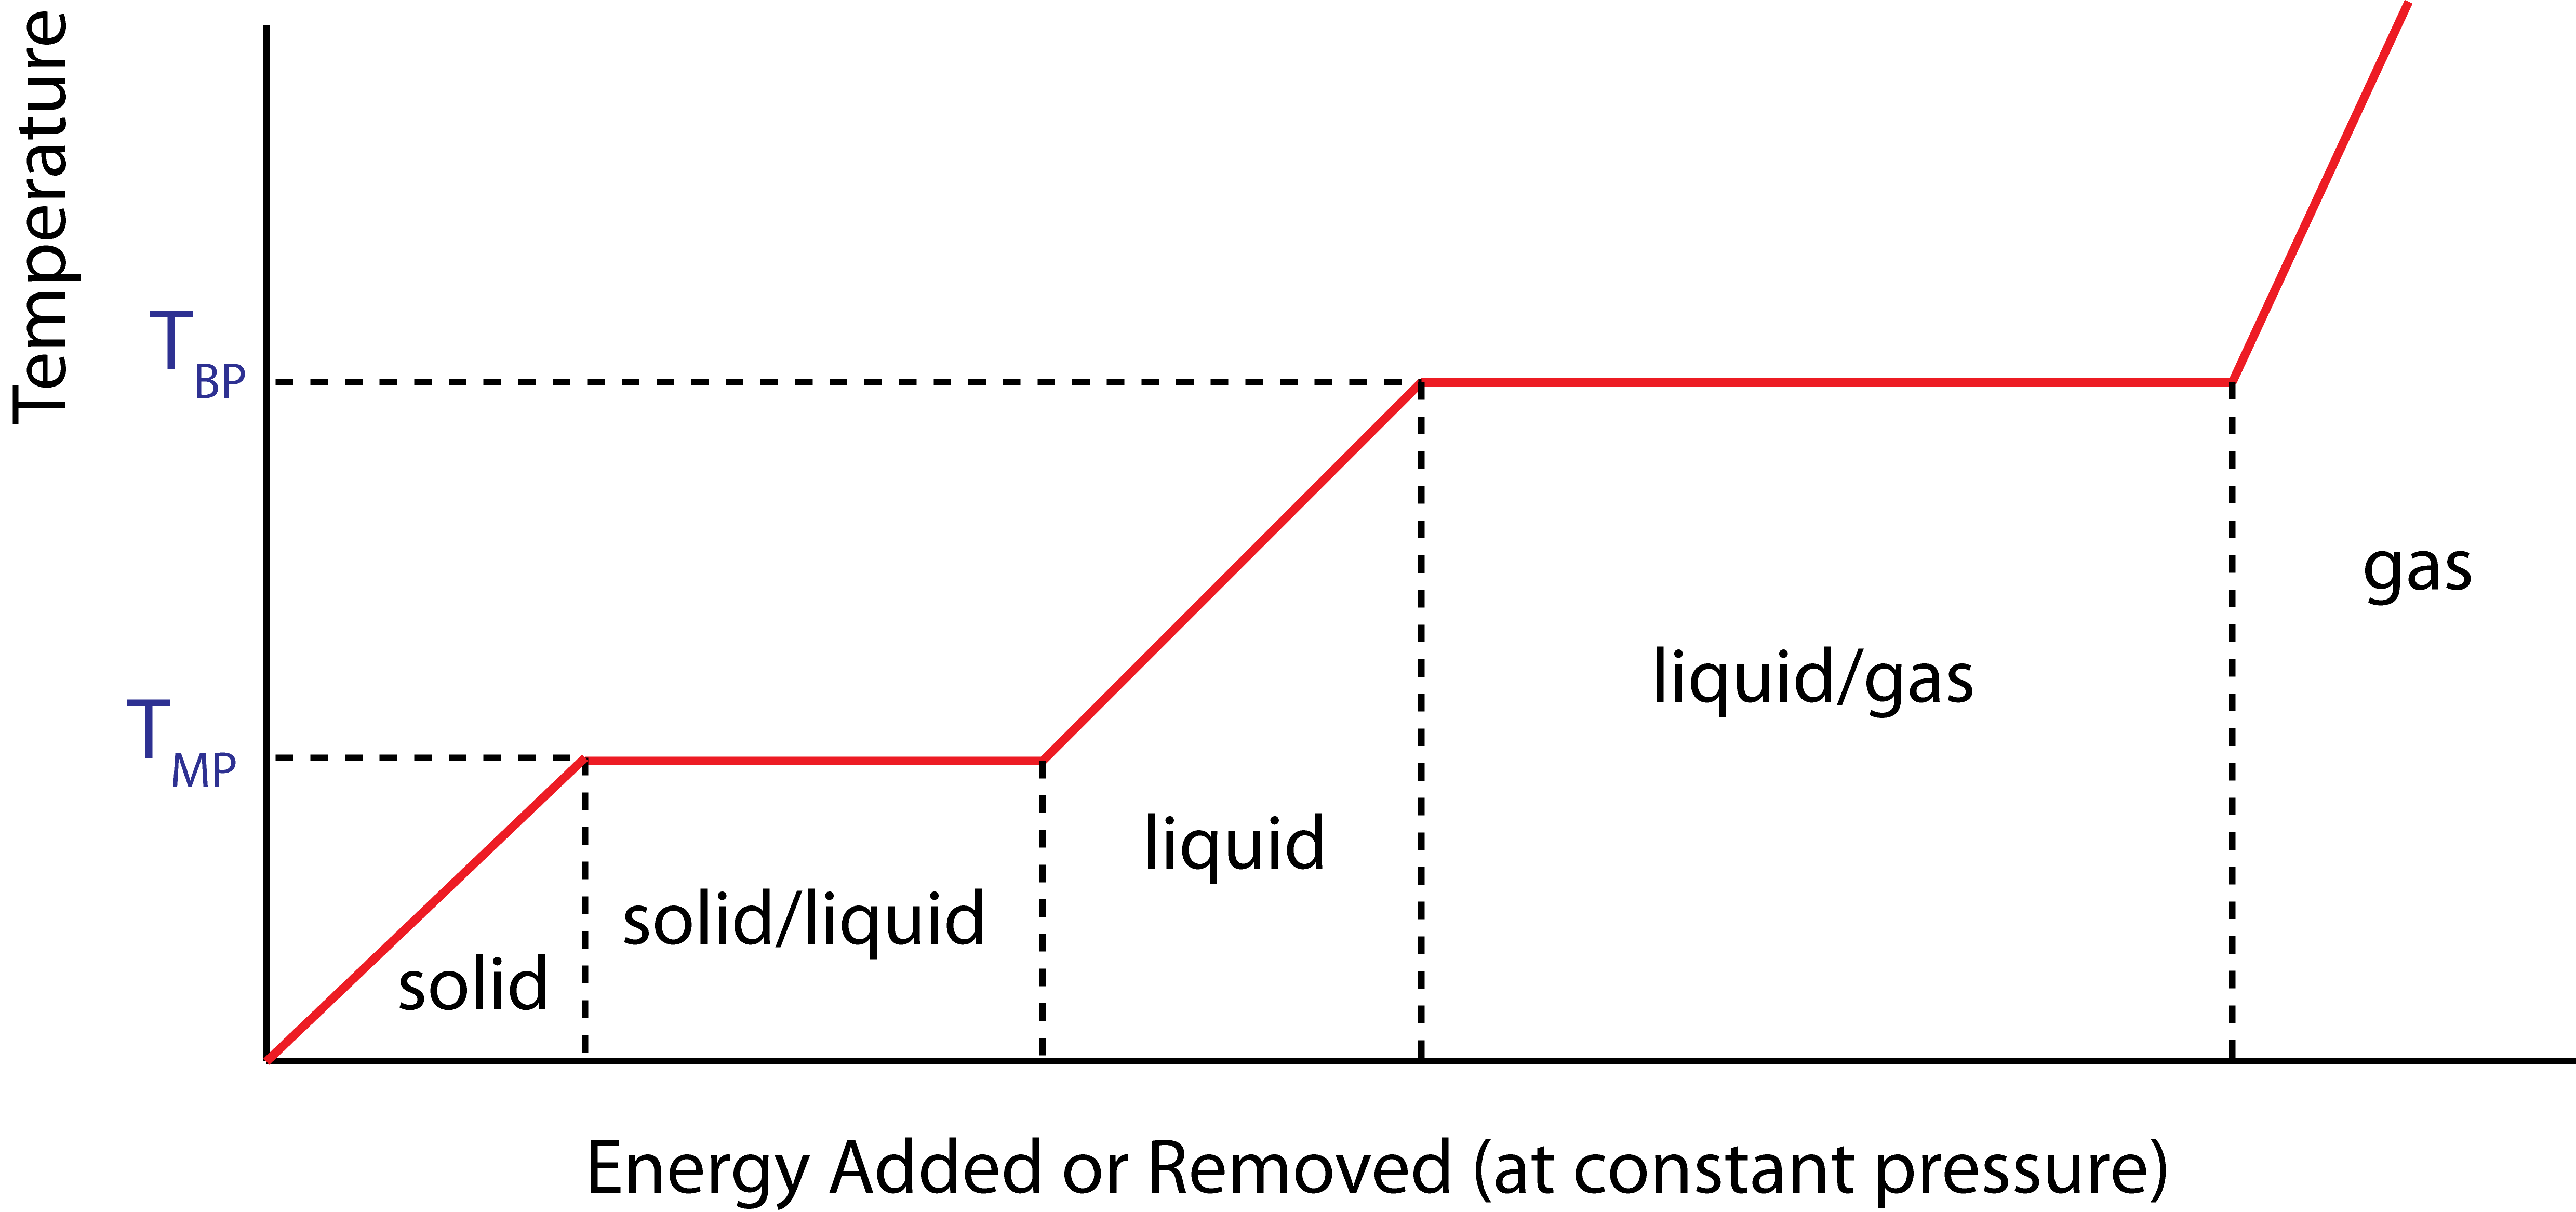
The graphical representation show below in Figure 1.1.2 summarizes the relationships of the model. The diagram depicts how a pure substance goes through the three basics phases as energy is added (moving to the right along the x-axis) or removed (moving to the left along the x-axis) as a function of temperature. We will discover later in the course that the energy changes of the substance that result in temperature or phase changes can be modeled with a microscopic atomic point of view. Thus, we will refer to these energies as internal energies of our system.
Figure 1.1.2 – Temperature vs. Energy Added Diagram
In the simplest form of the Three-Phase Model of Matter, the phase changes occur at the same temperature in either direction of the phase transition. That is, the temperature of the change from liquid to solid as energy is removed is the same as the temperature of the phase change from solid to liquid as energy is added. Due to this symmetry, the liquid-solid or solid-liquid phase change temperature can be referred to as either the freezing or melting temperature. Likewise, the liquid-gas or gas-liquid phase change temperature can be referred to as the boiling or condensation temperature.
It is very important to realize that the x-axis in Figure 1.1.2 represents energies that are added (or removed) to (from) the system, rather than absolute values of energy. The distinction between changes in energy and absolute values of energy, although seemingly subtle, is very crucial to understanding energy and its conservation. We will revisit this point throughout the entire course.
Although the picture appears to have a very simple structure, it is important to dig into the meaning of every piece. You need to ask questions like:
- What is the meaning of the horizontal portions of the graph?
- What is happening at the three slanted portions of the graph?
- What is the state of the substance at the "corners" in the graph?
- Can you explain in you own words “what is going on” physically in your drink with ice during a horizontal portion of the graph?
- Which horizontal portion would correspond to your cold drink?
- Where did the ice start out when you first put it into your cup? When was your drink system in thermal equilibrium, or was it ever in thermal equilibrium?
- Can you picture what is happening in terms of this representation when you boil water to make tea?
- How is this different from putting ice trays into the freezer compartment of your refrigerator?
By asking these kinds of questions you will practice using this representation so it becomes a useful tool to make sense of thermal phenomena and to be comfortable using it to construct explanations for particular phenomena.
Let us look at some of these questions. The plot is telling us that as energy is added to a solid, its temperature will increase until the solid reaches its melting point temperature, \(T_{MP}\). At the first "corner" in the diagram at \(T_{MP}\), the substance is still fully solid but at its melting temperature. Once the substance is at this state, any additional energy added will start the melting phase transition, and the substance will be in a mixed solid/liquid phase. When enough energy is added to the substance, the substance will be fully melted (all liquid) at its melting temperature, at the location of the second "corner" in the diagram. The process continues in a similar manner. As more energy is added, the liquid's temperature rises until it reaches its boiling point temperature, \(T_{BP}\). As more energy is added, the substance will be found in a mixed liquid gas phase, until enough energy is added to fully vaporize the liquid, resulting in a pure gas. After this, any additional energy will go into increasing the temperature of the gas.
The important thing to notice is that during a phase change, temperature remains constant even while energy is being added and the substance is in a mixed phase. In real life, this could be tested by boiling a pot of water while measuring temperature with a thermometer. If you do this yourself, you will find that the water temperature remains at exactly 100°C throughout the boiling process. Even as the flame continues to pour heat into the pot-water system, the water's temperature will not change until all the water is boiled away.
Note:
The same procedure described above follows if energy is being removed instead of added with different definitions of the phase changes: freezing instead of melting, and condensation instead of vaporization.
It is clear that something different is happening physically to the substance during the sloped (when temperature is changing) and the horizontal (when phase is changing) portions of the diagram. Thus, it is useful to give a separate definitions to the internal energy that is changing in the substance during each process. When added energy results in raising the temperature of the substance, we call this type of internal energy thermal energy, \(E_{thermal}\). When added energy results in changing the phase of the substance, we call this type of internal energy bond energy, \(E_{bond}\).
But you might be wondering, how can you find the amount of energy required, for example, to heat up a glass of water from room temperature at 25°C to its boiling temperature at 100°C? Or how much energy is removed from a glass of water, initially at room temperature, when placed in a freezer until it fully freezes? One way to do this is to do an experiment. You can imagine measuring the amount of energy that you add to a glass of water, and recording the amount of temperature that changes as that energy is added. This will lead us to the idea of specific heat. Likewise, you can measure the amount of energy required to fully melt or freeze some amount of water, known as heat of melting. The quantity associated with the amount of energy required to fully vaporize or condense some amount of substance, is known as heat of vaporization. In Chapter 3, we will also attempt to understand this phenomena from a microscopic atomic level, and make connections between atoms jiggling around at faster speeds to temperature increasing and specific heat. Likewise, we will look at the type of bonds that keep solids and liquids together, and how breaking those bonds or forming them is related to heat of melting.
Some other questions that arise when thinking about the Three-Phase Model may be:
- Does the diagram look different if we doubled the mass of the substance?
- How does the diagram change for different types of pure substances?
- What do the slopes of the solid, liquid, and gas curves represent? Why is the slope of the gas line appears to be steeper in this figure?
- Does it take the same amount of energy to fully melt and fully vaporize the same amount of a given substance?
We will address all of these questions during this course.