
1.2: Activities
- Page ID
- 45420

Equipment
- \(8\frac{1}{2}\times 11\) sheets of paper with two dots
- a ruler
- a compass for drawing circles (not for telling which way is north)
- a steel marble
- carbon paper
- wood plank landing area
- nail target
The General Idea
Humans are not able to aim precisely. If someone aims at a specific pinpoint target, the results of their attempts to hit the target will produce a scatter pattern around the target. If there are two targets, and the human aims at one of them, it may or may not be possible to determine from the scatter pattern which target was the goal, depending upon the proximity of the two targets and the amount of spread of the scatter pattern.
In this lab, we will create these conditions in the following way:
- We are provided an \(8\frac{1}{2} \times 11\) piece of paper with two dots (targets) on it. Taping this paper to the cardboard landing area and inserting the nail into one of the dots to define the intended target gives us a region to record runs.
- Placing the carbon paper on top of the white paper gives us a means for recording the landing points of a steel marble dropped by a human aiming for the nail.
- After a number of drops, a scatter pattern is created on the white paper.
- After calculating the uncertainty in the scatter pattern, the spread from the average landing point can be computed mathematically, and then clearly delineated using the compass.
- The "spread circle" should immediately show whether the intended target can be determined, and if so, which one it was.
In an attempt to show how this procedure works for various degrees of uncertainty in the scatter pattern, you will do two separate experiments (use separate pieces of white paper for each) – one where the marble is dropped from a position above the head of the dropper, and one where the marble is dropped from waist-height. Important: It is possible for a human to hone their aim and improve their results with repeated trials, but we want every drop to be independent, so you should make sure that the dropper moves out of position after every drop, and starts fresh each time, giving them no way to make minute adjustments from the previous drop.
Data Analysis
[As this is your first 9-series lab, much more guidance will be given regarding the methodology than is typical. Future labs will have similar sorts of steps for data analysis, but will not be so spelled-out for you.]
For each of your two runs, do the following:
- Use the "average of averages" method outlined in Background Material to determine the average landing position of the marble. Multiple colors of ink will come in handy, to help you keep straight all the dots on the paper.
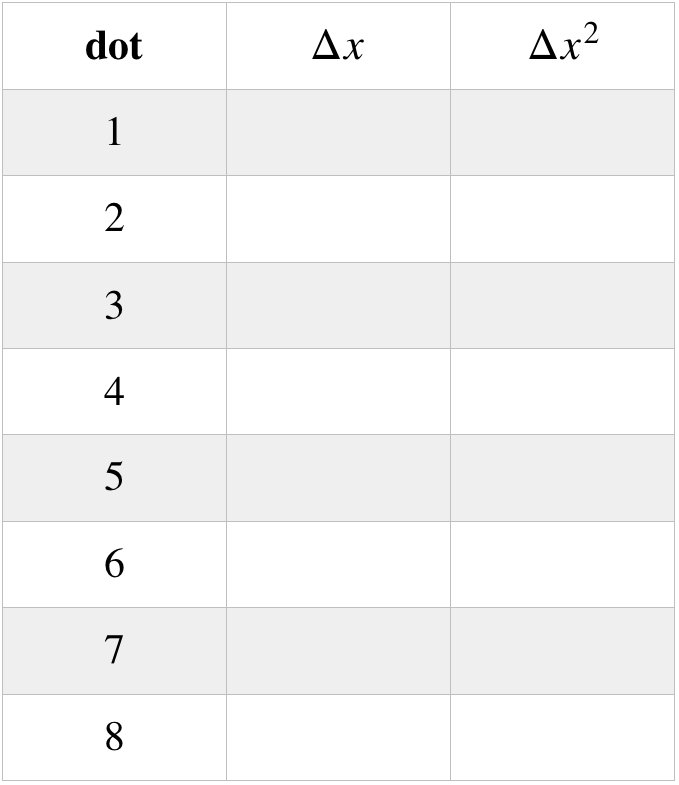
- Compute the standard deviation of the position from the average landing position, using the ruler to measure how far each data point is from the average. Creating a table like the one shown below will be helpful. Also, rounding the measurements of \(\Delta x\) to the nearest half-centimeter and using two significant figures for \(\Delta x^2\) should be plenty of precision.
- Use the compass and the ruler to draw a circle (probably best to use pencil) centered at the average landing position, with a radius equal to the uncertainty (standard deviation).
Hypothesis
In any other experiment, developing an hypothesis comes before the data collection and analysis. In this exercise we have placed it later, because the experiment doesn't test any actual physical principles, but has rather just been contrived to illustrate the concept of uncertainty. Whenever performing an experiment, the hypothesis outlines the expected results. In this experiment, since we are aiming at a specific point on the paper, the hypothesis is as simple as, "The person is dropping the marble on the target point on the paper." While no individual drop actually hits this target point, the hypothesis states what would happen if all of the uncertainty could be removed (i.e. if the person had perfect aim).
So how do we use our data to confirm the hypothesis? The short answer is that we check to see if the expected result lands within the uncertainty range of the experimental result (i.e. the average). In terms of what we have done here, the hypothesis is confirmed if the target point lies within the circle we have drawn around the average landing point.
But not so fast. The person may have actually been aiming at any number of points besides the target point – anywhere inside the circle, in fact. So it turns out that this hypothesis is too broad to be useful. A better hypothesis would be one that involves a comparison. This is why we have created two prospective targets, only one of which is the actual one, which we will call "Target A." Now we can form a more specific hypothesis: "Given that the person is aiming at one of the two targets, the target they are aiming at is A." Not all hypotheses can be boiled-down to two possibilities, but this is a nicely illustrative example. There are several possibilities here:
- only target A lies within the circle, confirming the hypothesis – It is important to understand that even with this confirmation, it doesn't prove beyond all doubt that the hypothesis is correct. It only confirms it to within our agreed-upon level of certainty.
- only target B lies within the circle, refuting the hypothesis – This would indicate that, to within uncertainty, the person was actually aiming at the other target.
- neither target lies within the circle – This result should lead us to reevaluate our starting point, where it was given that one of the two points was the target. Either that assumption was incorrect, or some mistakes were made in the experimental procedure or data analysis, or there was some unseen source of systematic error (e.g. a steady wind that blowing the marble horizontally during its journey).
- both targets lie within the circle – There are two possibilities for this result. First, it can be "fixed" by adding more trials, which will have the effect of moving the average landing point closer to the actual target (assuming no systematic errors), and farther from the alternative target, such that the latter then lands outside the uncertainty range. The second possibility is that the two targets are simply too close to each other for the degree of uncertainty we have. In this case, we say that the experiment "doesn't provide sufficient resolution" to confirm or refute the hypothesis.
Lab Report
Craft a lab report for these activities and analysis, making sure to include every contributing group member's name on the front page. You are strongly encouraged to refer back to the Read Me as you do this, to make sure that you are not leaving out anything important. You should also feel free to get feedback from your lab TA whenever you find that your group is at an impasse.
Every member of the group must upload a separate digital copy of the report to their lab assignment in Canvas prior to leaving the lab classroom. These reports are not to be written outside the lab setting.