
6.2: Activities
- Page ID
- 48858

Equipment
- carts & track
- laptop
- Pasco sensor devices
- cart linking accessories
- weights
- electronic weight scale
The General Idea
We have seen in the textbook that the impulse-momentum theorem is a repackaging of Newton's 2nd law:
\[\vec F = m\vec a = m\frac{d\vec v}{dt} = \frac{d\left(m\vec v\right)}{dt} = \frac{d\vec p}{dt}\;\;\;\Rightarrow\;\;\; \int\limits_a^b\vec F dt = \vec p_b-\vec p_a\]
We will use fancy sensing equipment to confirm this (as well as the 3rd law) by directly measuring all the physical quantities involved in different collisions. Specifically, you will make these impulse/momentum and 3rd law tests for three separate scenarios, all of them involving a stationary target cart:
- magnetic repulsion collision with carts of equal masses
- magnetic repulsion collision with carts of unequal masses
- link-up collision with carts of whatever masses you choose
In addition to your analysis of impulse and momentum, you should also say a few words (backed-up with data!) about the conservation or non-conservation of kinetic energy in each case.
Some Things to Think About
The Pasco equipment and laptop can be finicky. If you think it isn't working properly, don't waste time trying to debug it – call your TA over to assist you! Here are some things that should help, most of them related to proper use of the fancy equipment..
Here's how you get started with the equipment:
- If the carts are plugged into the laptop (they are charging), unplug them and press their power buttons. A red light should come on near the battery icon, and then the red light near the Bluetooth icon should start flashing.
- Go to the "Student" login in the laptop (there is no password), and open the 9A folder. Open the file "Momentum and Impulse."
- Run the application, and you will see what is shown below. Click the Bluetooth button at the top of the "Hardware Setup" window, and then scroll this window to the bottom.
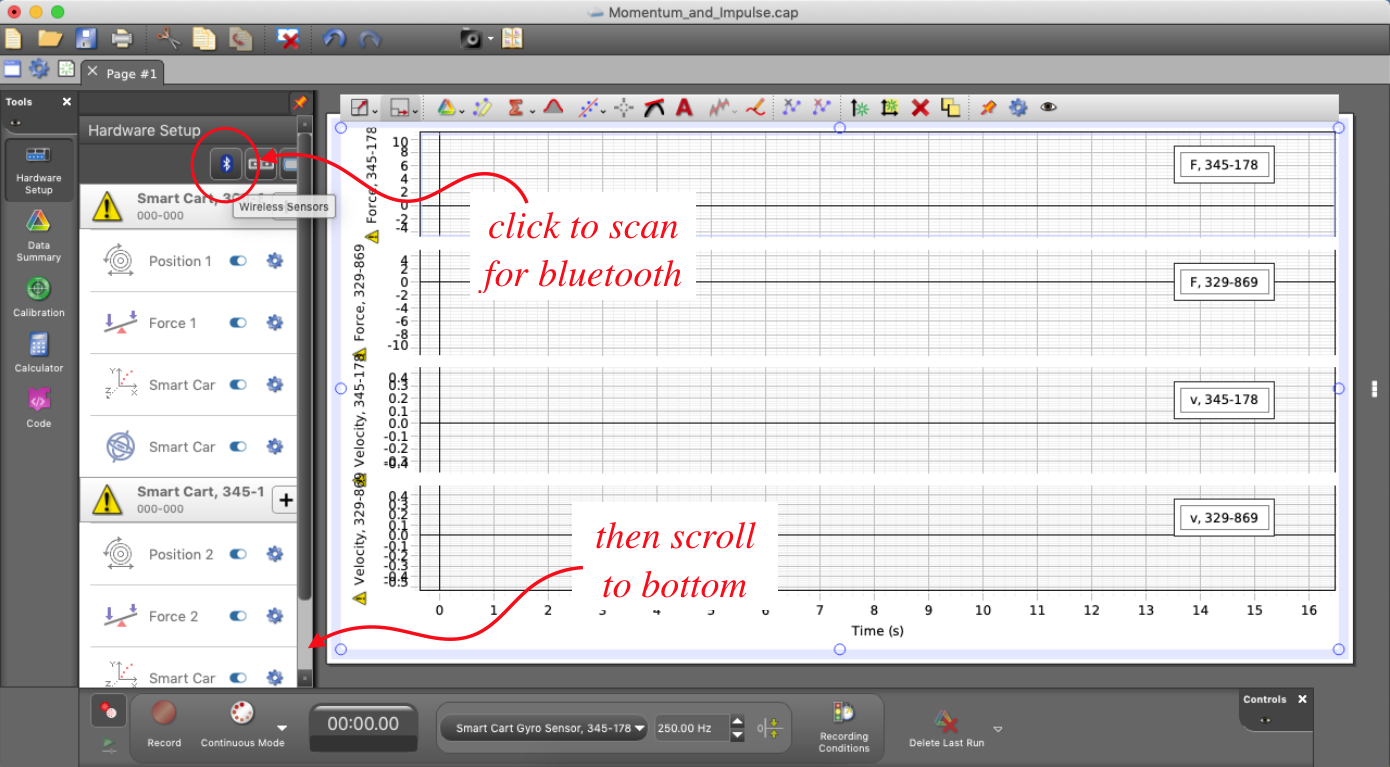
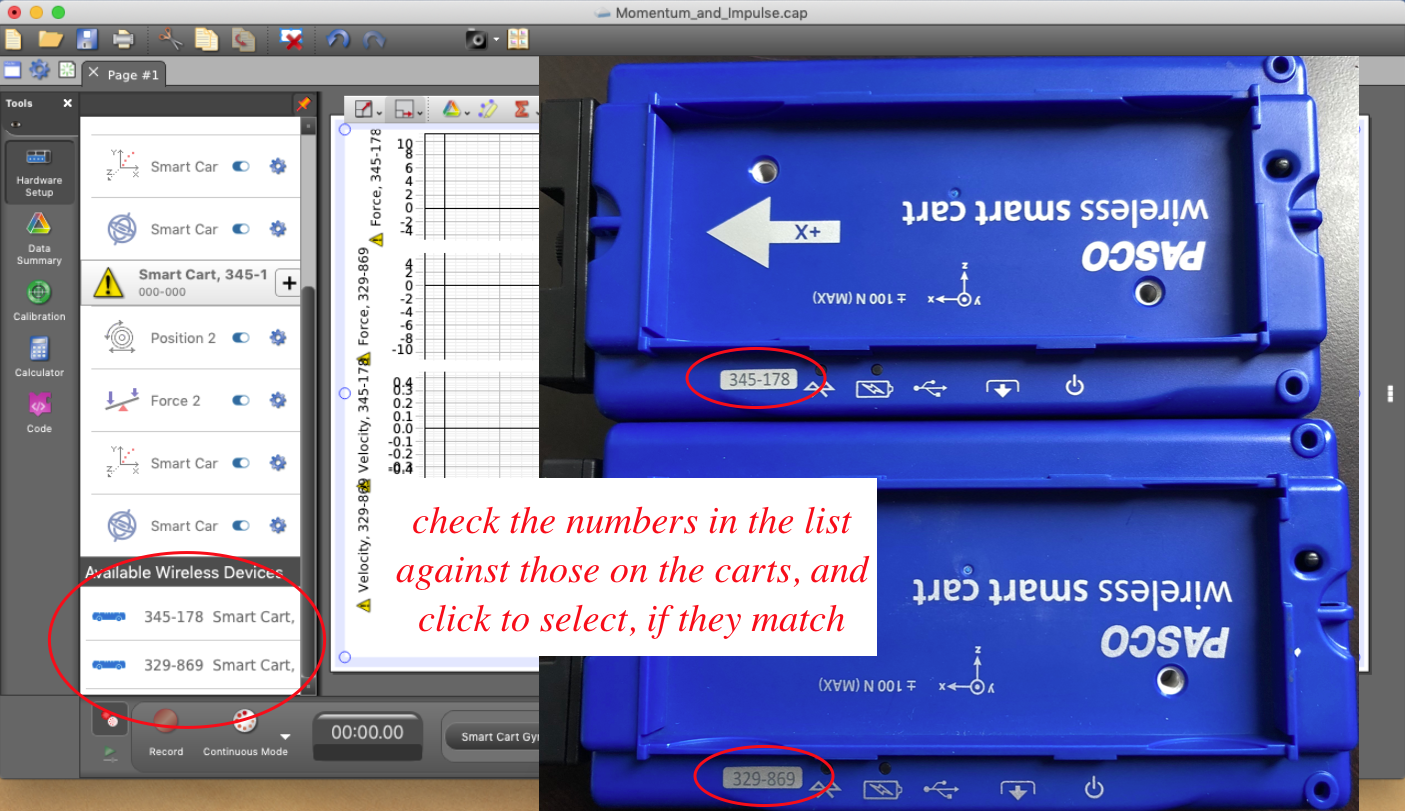
- You should find carts available for Bluetooth pairing at the bottom of the "Hardware Setup" window. Check to make sure that the carts listed are the same ones you will be using by comparing their numbers, then click on those carts to pair them to the computer. They should then be listed higher in the window.
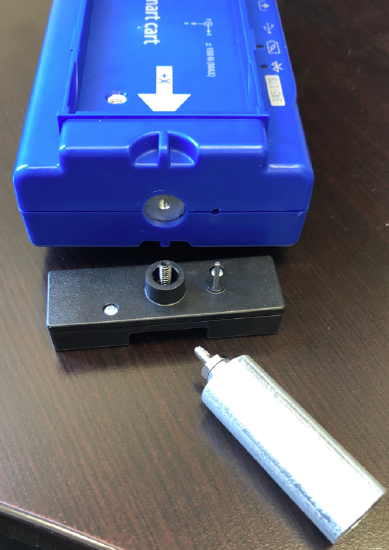
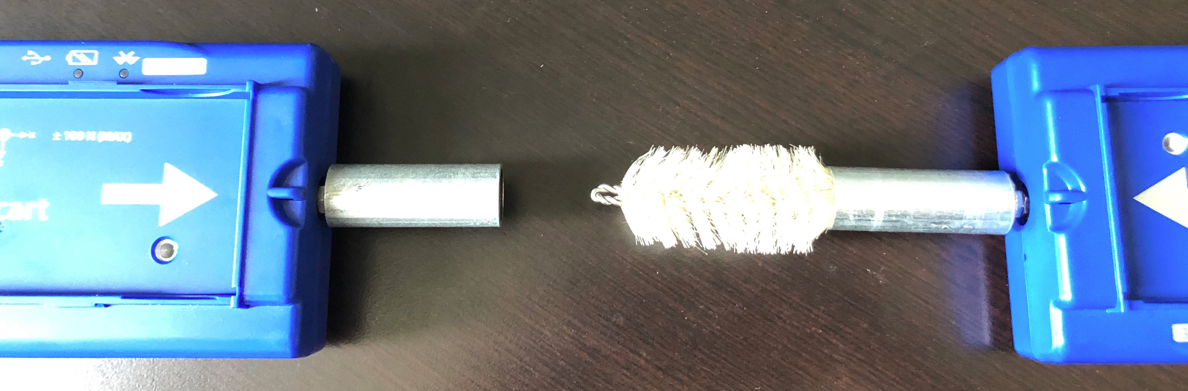
- When the time comes to do the link-up collision, you need to remove the magnets from the carts and replace them with the bottle-brush/tube links. Make sure that the brush that comes from one of the tubes pairs well with the other tube. If it does not, you can bend it slightly, but remove the brush from both tubes completely before doing this – don't torque the brush/tube while connected to the cart, or you may break the cart.
Some pointers while taking data:
- During the magnetic repulsion runs, do not push the incoming cart so hard that it contacts the other cart – the magnets should repel without an audible "clack." This will not only produce the best results, but will also avoid breaking the magnets.
- It is a good idea to set up your track so that the cart doesn't slow down or speed up very much when rolling on its own. There is going to be some effect due to friction in the wheels or from air resistance, but you should use the bubble level to make sure there is not a slant in the track affecting your results. Also, centering the carts in the track so that the sides don't drag is essential.
- The software has some useful tools for extracting data after a run, but it is also a little idiosyncratic. Here is what you need to know:
 is a tool that re-sizes the graphs to a scale that is easier to read.
 is the highlight tool. It provides a box for you to select a portion of a graph for future examination (see below).
 is the coordinate tool. When you click on it, you can move the cursor over a point on the graph, and it will display its exact coordinates.
 is the area-under-the-curve tool. The value of this tool in a lab involved with computing impulse should be obvious. To use this, first use the highlight tool to drag a box around the part of a curve that you want to integrate, then click on this icon to compute the area under that segment of curve.
- Important! You will have 4 graphs on your computer screen, and you will want to use tools on each one, but the software has a maddening "feature." The graph into which the tool appears is the last one that was selected. This is as it should be, but the software selects the graph by mouse-over, rather than by clicking. So if you want a tool to appear in the bottom graph, you need to make sure that was the last graph that your cursor was over before clicking the tool, which requires you to navigate the cursor around the other graphs on its way to clicking the tool.
- This lab doesn't include data tables, so you need some way to display your raw data. You should do this by taking screen captures of the graphs generated (after manipulating/magnifying them so they are easy to read). You can do this with command-shift-4, which gives you a cursor that you can drag into a box around the portion of the screen you wish to capture (the file will appear on the desktop). Getting this file from the desktop to where you can add it to your lab report is up to you. In order to do anything over a network (such as emailing the file to yourself or using Airdrop), you will need to log the lab laptop into eduroam under your login. You might also be able to take a photo of the computer screen.
- We will not be doing rigorous uncertainty analysis here (the uncertainties inherent to our black-box-measuring-apparatus are not immediately apparent), but some reckoning of how far off the results are from what you predict (oh, btw, you should be hypothesizing results in each case!) is expected. As with most experiments we do, if you are off by more than 10%, you should probably assume you made an error somewhere. Either you made an incorrect hypothesis, or something went wrong in your analysis of the data.
- When you are finished with the equipment, please power-down the carts and plug them into the laptops with their USB cords, so that they are charged for the next lab.
Lab Report
Craft a lab report for these activities and analysis, making sure to include every contributing group member's name on the front page. You are strongly encouraged to refer back to the Read Me as you do this, to make sure that you are not leaving out anything important. You should also feel free to get feedback from your lab TA whenever you find that your group requires clarification or is at an impasse.
Every member of the group must upload a separate digital copy of the report to their lab assignment in Canvas prior to leaving the lab classroom. These reports are not to be written outside the lab setting.