
5.1: Background Material
- Page ID
- 23044

Text References
Component Board Again
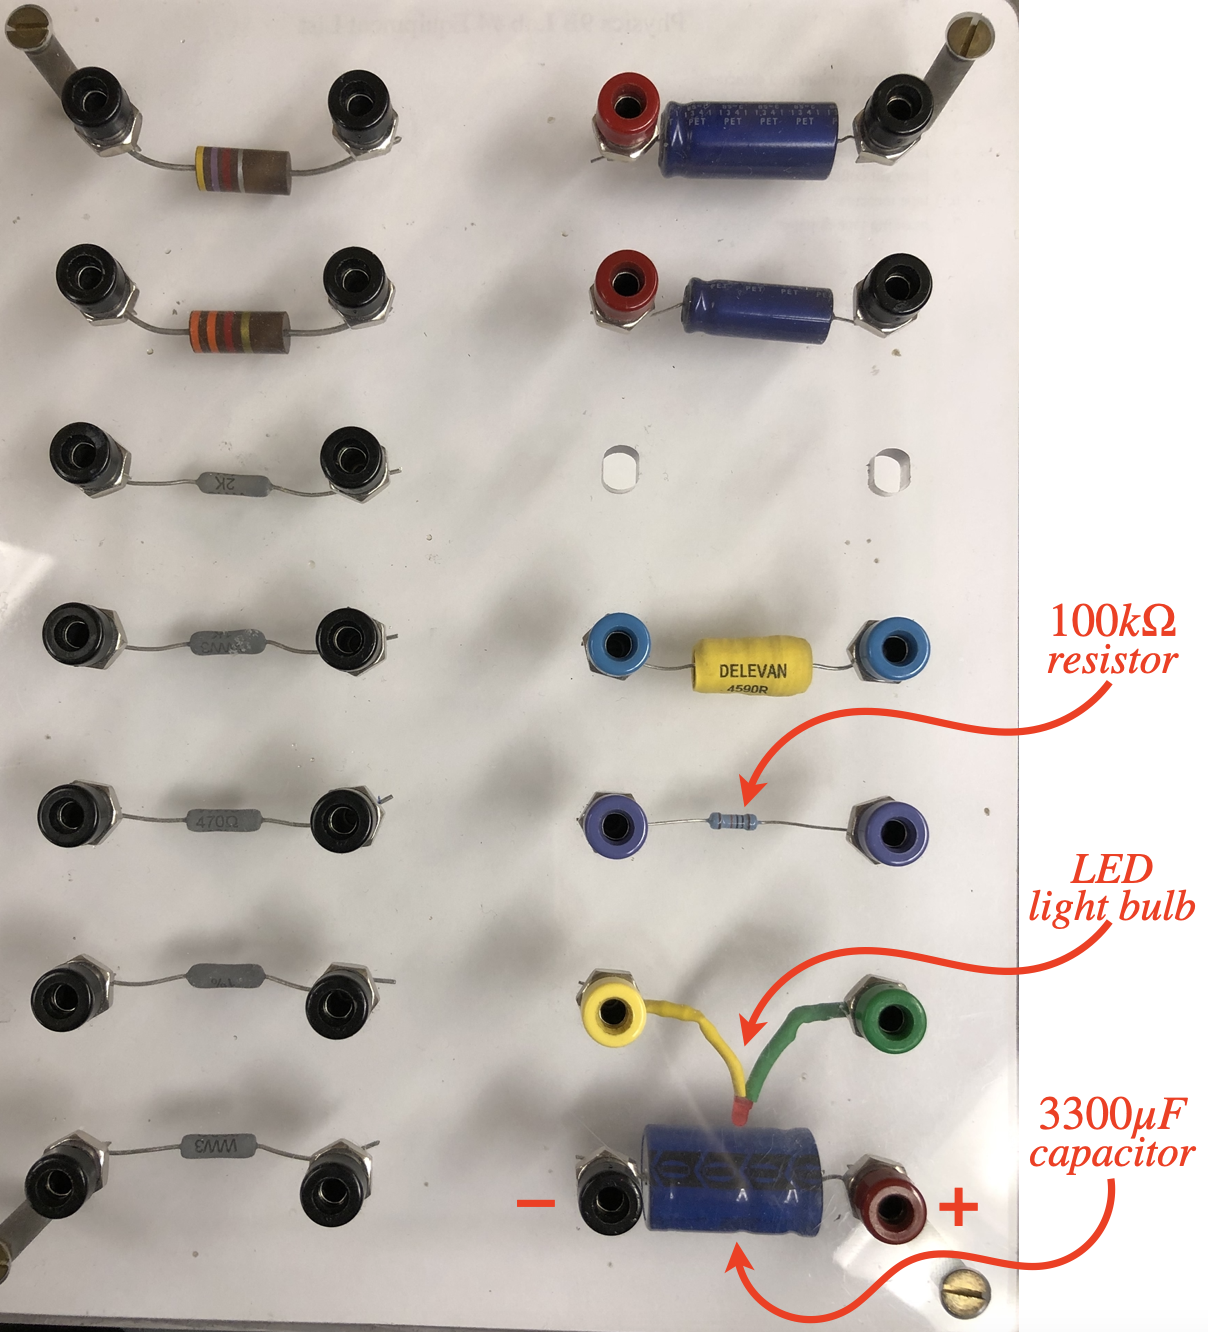
We'll be using the component board again for various parts of this lab. See the diagram below for the components you will be using in this lab:
Reading an Oscilloscope
At first glance, an oscilloscope is an intimidating device, with a daunting number of knobs and switches. We will not concern ourselves with the various nuances of this device, and will instead focus on taking away some of the mystery, so that we can use it. First and foremost, this device is a voltmeter. Two leads come out of each "channel," and the o-scope measures the difference in voltage between these two leads.
Where an oscilloscope differs from a standard voltmeter is that it also reflects the time dependence of that voltage difference. If we connect a regular voltmeter across a component for which the voltage is varying with time, the needle of the voltmeter would jump around in response to the changing voltage drop. An oscilloscope graphs the time dependence of that changing voltage – the vertical axis of the output is the voltage drop, and the horizontal axis is time.
The scope does not graph the voltage between fixed starting and ending times – it graphs continually. It's easiest to think of it as "wrapping around" – when the plot gets to the right side of the screen, it continues plotting from the left side. For this reason, this device is most effective for studying periodic time dependence (thus the prefix "oscillo-"). These plots repeat themselves, leaving a static pattern on the screen that can easily be studied.
Let's look at what some of the important knobs do (again, we will not take the time to learn every nuance of this device here):
Figure 7.1.1 – Oscilloscope

The simplest of the knobs to understand are the position knobs – these move the whole graph up/down and right/left. This adjustment is available to make it easier to read values off the graph. At the bottom of the vertical part of the front panel are the ports where the probes connect to the device. For our lab, we will only be measuring a single voltage difference, so there is only a cable attached to channel 1.
The important knobs to understand are those labeled "VOLTS/DIV" and "SEC/DIV" (for our experiment, only the knob setting for channel 1 matters). We'll look at each knob in turn, but first you should note that the o-scope screen is divided into a grid of large squares, which are each subdivided horizontally and vertically with 5 tick marks. It is the lattice of grid lines (the blocks) that are calibrated to the knob settings – the smaller tick marks represent one fifth of these measurements.
- VOLTS/DIV – The number found within the bracket equals the value of each vertical division of a block. You'll note that there are two brackets – so which one gives the proper number? Both, because they measure in different units. The multiplier next to each bracket indicates how much the actual value is amplified by the oscilloscope before graphing it note that in both cases, a difference of one vertical block represents a voltage difference of 0.02 volts:
- Reading the left bracket: The signal is multiplied by 1, and a block measures 20 millivolts.
- Reading the right bracket: The signal is multiplied by 10, and a block measures 0.2 volts.
- SEC/DIV – In this case, there is only one place to read the time intervals for blocks – between the two lines that radiate from the center of the knob. This particular knob is set at 2 milliseconds.
It should be clear that turning the vertical knob clockwise will make a graph shorter (each block's vertical value is increased), and turning the horizontal knob clockwise will squeeze together the wave peaks (each block's horizontal value is increased).