
21.2: The H-R and the Study of Stellar Evolution


- Last updated
- Apr 11, 2022
- Save as PDF

( \newcommand{\kernel}{\mathrm{null}\,}\)
Learning Objectives
By the end of this section, you will be able to:
- Determine the age of a protostar using an H–R diagram and the protostar’s luminosity and temperature
- Explain the interplay between gravity and pressure, and how the contracting protostar changes its position in the H–R diagram as a result
One of the best ways to summarize all of these details about how a star or protostar changes with time is to use a Hertzsprung-Russell (H–R) diagram. Recall from The Stars: A Celestial Census that, when looking at an H–R diagram, the temperature (the horizontal axis) is plotted increasing toward the left. As a star goes through the stages of its life, its luminosity and temperature change. Thus, its position on the H–R diagram, in which luminosity is plotted against temperature, also changes. As a star ages, we must replot it in different places on the diagram. Therefore, astronomers often speak of a star moving on the H–R diagram, or of its evolution tracing out a path on the diagram. In this context, “tracing out a path” has nothing to do with the star’s motion through space; this is just a shorthand way of saying that its temperature and luminosity change as it evolves.
Watch an animation of the stars in the Omega Centauri cluster as they rearrange according to luminosity and temperature, forming a Hertzsprung-Russell (H–R) diagram.
To estimate just how much the luminosity and temperature of a star change as it ages, we must resort to calculations. Theorists compute a series of models for a star, with each successive model representing a later point in time. Stars may change for a variety of reasons. Protostars, for example, change in size because they are contracting, and their temperature and luminosity change as they do so. After nuclear fusion begins in the star’s core (see Stars from Adolescence to Old Age), main-sequence stars change because they are using up their nuclear fuel.
Given a model that represents a star at one stage of its evolution, we can calculate what it will be like at a slightly later time. At each step, the model predicts the luminosity and size of the star, and from these values, we can figure out its surface temperature. A series of points on an H–R diagram, calculated in this way, allows us to follow the life changes of a star and hence is called its evolutionary track.
Evolutionary Tracks
Let’s now use these ideas to follow the evolution of protostars that are on their way to becoming main-sequence stars. The evolutionary tracks of newly forming stars with a range of stellar masses are shown in Figure 21.2.1. These young stellar objects are not yet producing energy by nuclear reactions, but they derive energy from gravitational contraction—through the sort of process proposed for the Sun by Helmhotz and Kelvin in this last century (see the chapter on The Sun: A Nuclear Powerhouse).
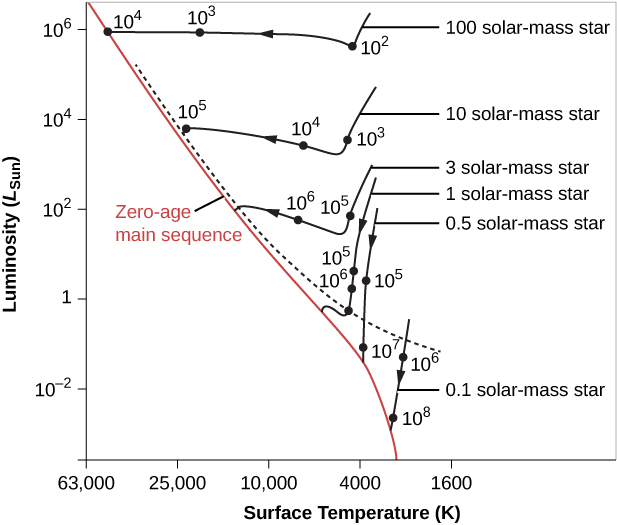
Initially, a protostar remains fairly cool with a very large radius and a very low density. It is transparent to infrared radiation, and the heat generated by gravitational contraction can be radiated away freely into space. Because heat builds up slowly inside the protostar, the gas pressure remains low, and the outer layers fall almost unhindered toward the center. Thus, the protostar undergoes very rapid collapse, a stage that corresponds to the roughly vertical lines at the right of Figure 21.2.1. As the star shrinks, its surface area gets smaller, and so its total luminosity decreases. The rapid contraction stops only when the protostar becomes dense and opaque enough to trap the heat released by gravitational contraction.
When the star begins to retain its heat, the contraction becomes much slower, and changes inside the contracting star keep the luminosity of stars like our Sun roughly constant. The surface temperatures start to build up, and the star “moves” to the left in the H–R diagram. Stars first become visible only after the stellar wind described earlier clears away the surrounding dust and gas. This can happen during the rapid-contraction phase for low-mass stars, but high-mass stars remain shrouded in dust until they end their early phase of gravitational contraction (see the dashed line in Figure 21.2.1).
To help you keep track of the various stages that stars go through in their lives, it can be useful to compare the development of a star to that of a human being. (Clearly, you will not find an exact correspondence, but thinking through the stages in human terms may help you remember some of the ideas we are trying to emphasize.) Protostars might be compared to human embryos—as yet unable to sustain themselves but drawing resources from their environment as they grow. Just as the birth of a child is the moment it is called upon to produce its own energy (through eating and breathing), so astronomers say that a star is born when it is able to sustain itself through nuclear reactions (by making its own energy.)
When the star’s central temperature becomes high enough (about 12 million K) to fuse hydrogen into helium, we say that the star has reached the main sequence (a concept introduced in The Stars: A Celestial Census). It is now a full-fledged star, more or less in equilibrium, and its rate of change slows dramatically. Only the gradual depletion of hydrogen as it is transformed into helium in the core slowly changes the star’s properties.
The mass of a star determines exactly where it falls on the main sequence. As Figure 21.2.1 shows, massive stars on the main sequence have high temperatures and high luminosities. Low-mass stars have low temperatures and low luminosities.
Objects of extremely low mass never achieve high-enough central temperatures to ignite nuclear reactions. The lower end of the main sequence stops where stars have a mass just barely great enough to sustain nuclear reactions at a sufficient rate to stop gravitational contraction. This critical mass is calculated to be about 0.075 times the mass of the Sun. As we discussed in the chapter on Analyzing Starlight, objects below this critical mass are called either brown dwarfs or planets. At the other extreme, the upper end of the main sequence terminates at the point where the energy radiated by the newly forming massive star becomes so great that it halts the accretion of additional matter. The upper limit of stellar mass is between 100 and 200 solar masses.
Evolutionary Timescales
How long it takes a star to form depends on its mass. The numbers that label the points on each track in Figure 21.2.1 are the times, in years, required for the embryo stars to reach the stages we have been discussing. Stars of masses much higher than the Sun’s reach the main sequence in a few thousand to a million years. The Sun required millions of years before it was born. Tens of millions of years are required for stars of lower mass to evolve to the lower main sequence. (We will see that this turns out to be a general principle: massive stars go through all stages of evolution faster than low-mass stars do.)
We will take up the subsequent stages in the life of a star in Stars from Adolescence to Old Age, examining what happens after stars arrive in the main sequence and begin a “prolonged adolescence” and “adulthood” of fusing hydrogen to form helium. But now we want to examine the connection between the formation of stars and planets.
Summary
The evolution of a star can be described in terms of changes in its temperature and luminosity, which can best be followed by plotting them on an H–R diagram. Protostars generate energy (and internal heat) through gravitational contraction that typically continues for millions of years, until the star reaches the main sequence.