
12.4: Unit 7 Lab- Elastic Modulus and Ultimate Strength
- Page ID
- 17820

\( \newcommand{\vecs}[1]{\overset { \scriptstyle \rightharpoonup} {\mathbf{#1}} } \)
\( \newcommand{\vecd}[1]{\overset{-\!-\!\rightharpoonup}{\vphantom{a}\smash {#1}}} \)
\( \newcommand{\id}{\mathrm{id}}\) \( \newcommand{\Span}{\mathrm{span}}\)
( \newcommand{\kernel}{\mathrm{null}\,}\) \( \newcommand{\range}{\mathrm{range}\,}\)
\( \newcommand{\RealPart}{\mathrm{Re}}\) \( \newcommand{\ImaginaryPart}{\mathrm{Im}}\)
\( \newcommand{\Argument}{\mathrm{Arg}}\) \( \newcommand{\norm}[1]{\| #1 \|}\)
\( \newcommand{\inner}[2]{\langle #1, #2 \rangle}\)
\( \newcommand{\Span}{\mathrm{span}}\)
\( \newcommand{\id}{\mathrm{id}}\)
\( \newcommand{\Span}{\mathrm{span}}\)
\( \newcommand{\kernel}{\mathrm{null}\,}\)
\( \newcommand{\range}{\mathrm{range}\,}\)
\( \newcommand{\RealPart}{\mathrm{Re}}\)
\( \newcommand{\ImaginaryPart}{\mathrm{Im}}\)
\( \newcommand{\Argument}{\mathrm{Arg}}\)
\( \newcommand{\norm}[1]{\| #1 \|}\)
\( \newcommand{\inner}[2]{\langle #1, #2 \rangle}\)
\( \newcommand{\Span}{\mathrm{span}}\) \( \newcommand{\AA}{\unicode[.8,0]{x212B}}\)
\( \newcommand{\vectorA}[1]{\vec{#1}} % arrow\)
\( \newcommand{\vectorAt}[1]{\vec{\text{#1}}} % arrow\)
\( \newcommand{\vectorB}[1]{\overset { \scriptstyle \rightharpoonup} {\mathbf{#1}} } \)
\( \newcommand{\vectorC}[1]{\textbf{#1}} \)
\( \newcommand{\vectorD}[1]{\overrightarrow{#1}} \)
\( \newcommand{\vectorDt}[1]{\overrightarrow{\text{#1}}} \)
\( \newcommand{\vectE}[1]{\overset{-\!-\!\rightharpoonup}{\vphantom{a}\smash{\mathbf {#1}}}} \)
\( \newcommand{\vecs}[1]{\overset { \scriptstyle \rightharpoonup} {\mathbf{#1}} } \)
\( \newcommand{\vecd}[1]{\overset{-\!-\!\rightharpoonup}{\vphantom{a}\smash {#1}}} \)
\(\newcommand{\avec}{\mathbf a}\) \(\newcommand{\bvec}{\mathbf b}\) \(\newcommand{\cvec}{\mathbf c}\) \(\newcommand{\dvec}{\mathbf d}\) \(\newcommand{\dtil}{\widetilde{\mathbf d}}\) \(\newcommand{\evec}{\mathbf e}\) \(\newcommand{\fvec}{\mathbf f}\) \(\newcommand{\nvec}{\mathbf n}\) \(\newcommand{\pvec}{\mathbf p}\) \(\newcommand{\qvec}{\mathbf q}\) \(\newcommand{\svec}{\mathbf s}\) \(\newcommand{\tvec}{\mathbf t}\) \(\newcommand{\uvec}{\mathbf u}\) \(\newcommand{\vvec}{\mathbf v}\) \(\newcommand{\wvec}{\mathbf w}\) \(\newcommand{\xvec}{\mathbf x}\) \(\newcommand{\yvec}{\mathbf y}\) \(\newcommand{\zvec}{\mathbf z}\) \(\newcommand{\rvec}{\mathbf r}\) \(\newcommand{\mvec}{\mathbf m}\) \(\newcommand{\zerovec}{\mathbf 0}\) \(\newcommand{\onevec}{\mathbf 1}\) \(\newcommand{\real}{\mathbb R}\) \(\newcommand{\twovec}[2]{\left[\begin{array}{r}#1 \\ #2 \end{array}\right]}\) \(\newcommand{\ctwovec}[2]{\left[\begin{array}{c}#1 \\ #2 \end{array}\right]}\) \(\newcommand{\threevec}[3]{\left[\begin{array}{r}#1 \\ #2 \\ #3 \end{array}\right]}\) \(\newcommand{\cthreevec}[3]{\left[\begin{array}{c}#1 \\ #2 \\ #3 \end{array}\right]}\) \(\newcommand{\fourvec}[4]{\left[\begin{array}{r}#1 \\ #2 \\ #3 \\ #4 \end{array}\right]}\) \(\newcommand{\cfourvec}[4]{\left[\begin{array}{c}#1 \\ #2 \\ #3 \\ #4 \end{array}\right]}\) \(\newcommand{\fivevec}[5]{\left[\begin{array}{r}#1 \\ #2 \\ #3 \\ #4 \\ #5 \\ \end{array}\right]}\) \(\newcommand{\cfivevec}[5]{\left[\begin{array}{c}#1 \\ #2 \\ #3 \\ #4 \\ #5 \\ \end{array}\right]}\) \(\newcommand{\mattwo}[4]{\left[\begin{array}{rr}#1 \amp #2 \\ #3 \amp #4 \\ \end{array}\right]}\) \(\newcommand{\laspan}[1]{\text{Span}\{#1\}}\) \(\newcommand{\bcal}{\cal B}\) \(\newcommand{\ccal}{\cal C}\) \(\newcommand{\scal}{\cal S}\) \(\newcommand{\wcal}{\cal W}\) \(\newcommand{\ecal}{\cal E}\) \(\newcommand{\coords}[2]{\left\{#1\right\}_{#2}}\) \(\newcommand{\gray}[1]{\color{gray}{#1}}\) \(\newcommand{\lgray}[1]{\color{lightgray}{#1}}\) \(\newcommand{\rank}{\operatorname{rank}}\) \(\newcommand{\row}{\text{Row}}\) \(\newcommand{\col}{\text{Col}}\) \(\renewcommand{\row}{\text{Row}}\) \(\newcommand{\nul}{\text{Nul}}\) \(\newcommand{\var}{\text{Var}}\) \(\newcommand{\corr}{\text{corr}}\) \(\newcommand{\len}[1]{\left|#1\right|}\) \(\newcommand{\bbar}{\overline{\bvec}}\) \(\newcommand{\bhat}{\widehat{\bvec}}\) \(\newcommand{\bperp}{\bvec^\perp}\) \(\newcommand{\xhat}{\widehat{\xvec}}\) \(\newcommand{\vhat}{\widehat{\vvec}}\) \(\newcommand{\uhat}{\widehat{\uvec}}\) \(\newcommand{\what}{\widehat{\wvec}}\) \(\newcommand{\Sighat}{\widehat{\Sigma}}\) \(\newcommand{\lt}{<}\) \(\newcommand{\gt}{>}\) \(\newcommand{\amp}{&}\) \(\definecolor{fillinmathshade}{gray}{0.9}\)Elasticity
Materials:
- lab sheet and writing utensil
- calculator
- thin (roughly 1 mm x 1 mm) rubber band and place to hang it (e.g. cabinet handle)
- Ruler with mm precision
- spreadsheet and graphing software
- for distance learners, access to online forums, videos, and help features for the spreadsheet software will likely be necessary
- one of the following equipment sets:
- force sensor + computer with sensor control and analysis software
- collection of weights with hooks, from 0.01 kg to 1 kg
Observation
Rubber bands behave elastically and they also appear to have a “crimping” behavior similar to tendons. When relaxed the bands tend to curl up and it takes a small force to straighten them out, then once straight, they provide more resistance to being stretched.
Question
Are rubber bands a good model for tendons?
Search Existing Knowledge
Find an example stress-strain curve for a tendon. What is the name of the region caused by “crimping” behavior? What is the elastic modulus of human tendon? What is the ultimate strength of human tendon? List your sources for this information.
Hypothesis
Provide a qualitative hypothesis that compares the stress-strain behavior of rubber bands and tendons. That means state which parts of the stress-strain curve for a tendon you expect will also appear in the rubber band curve. Explain your reasoning.
Also state whether you expect rubber bands or tendons to have a larger elastic modulus and ultimate strength. Explain your reasoning.
Test
To test your hypotheses you will create a stress-strain curve for the rubber band.
Our method will be measure the stretch distance as additional force is added to the band. In order to determine stress and strain we will need to know the original length and cross-sectional area of the rubber band.
Hang the rubber band from a cabinet handle, ring stand, or other feature capable of supporting about 20 lbs (or enough force to rupture your rubber band). If you are using a rubber band larger than 1 mm x 1 mm, then you may have a difficult reaching the ultimate strength of the rubber band:
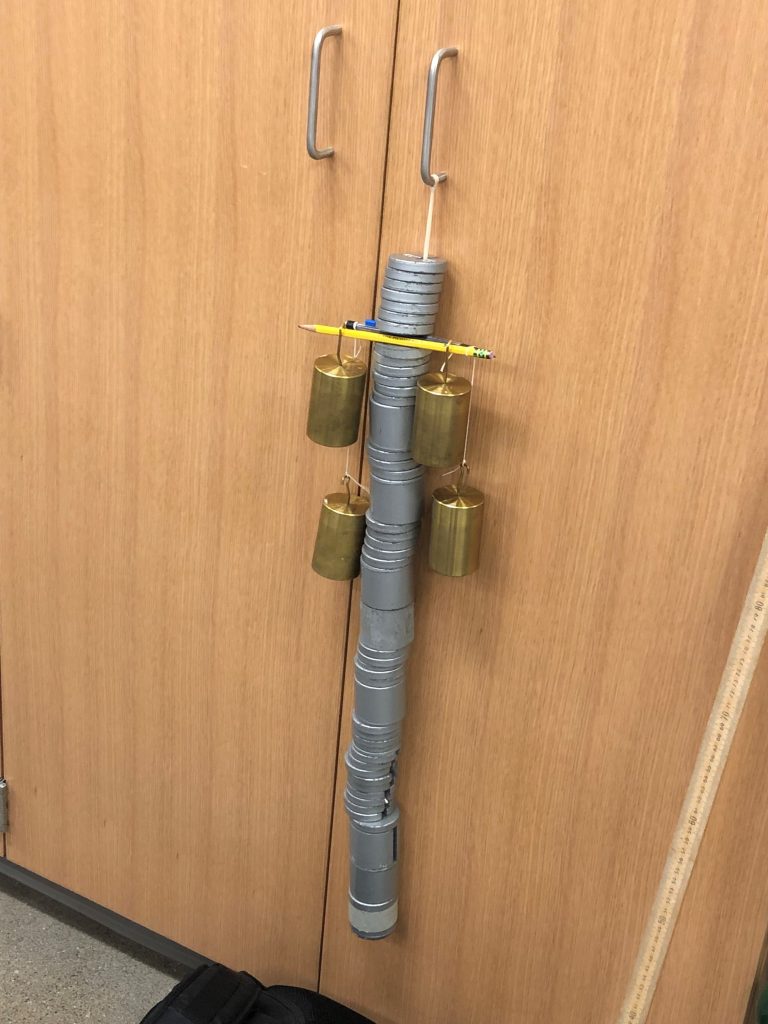
Photograph of a 1 mm x 3 mm rubber band during stress testing. The band runs through the slots in the gray weights and the hook attached to the bottom of the band is just visible through the slot in the lowest group of smaller (0.98 N) weights. The 119 N of force is applying 1.3 x 10¹³Pa of stress, causing a strain of 660 %. Photo credit: Umpqua Community College student Samual Marsters.
Use your ruler to measure the relaxed length of the hanging rubber band and record here:_________
Measure the width and thickness of the rubber band and multiply to get the cross-sectional area. Record the measurements here: Width_________ Thickness___________ Show your work in calculating the cross-sectional area below:
Convert your area to square meters (m2), show your work below:
If you are using a force sensor, be sure to zero the sensor in the vertical orientation. If you are using pennies, determine the weight of a single penny in units of Newtons, if you are using known masses then remember to calculate their weights as you go.
Now we will pull on the band with the force sensor (or pennies or weights) and measure the force and length, then use the initial length and area to calculate stress and strain. Start with your smallest weight and work up so that you can determine if there is crimping behavior. Be sure to pull hard enough or add enough weight so that the length changes by at least 2 mm, (so the change is not obscured by the uncertainty in your length measurement). Continue until the rubber band begins to rupture. Record the results in the chart below.
| Hanging Mass (Kg) | Force (N) (from force sensor, or weight of pennies) | Length (mm) | Stress (N/m2) | Strain |
Analyze
Enter your data into a spreadsheet and create an x-y graph of stress vs. strain.
Be sure to give your graph a title and label the axes with the variable names and the units of measure.
Conclusion
Was your qualitative hypothesis about the shapes of stress-strain curves for tendons and rubber bands correct? Explain.
Analyze
What was the ultimate strength of the rubber band? Record here:__________
Conclusion
Was your hypothesis about the ultimate strength of rubber bands compared to tendons supported by your data? Explain.
Analyze
We need to find the elastic modulus, which tells us how the material resists strain. The elastic modulus is defined as the slope of the elastic region of the stress-strain curve. You can find the slope two ways: 1) slope is defined as rise over run. Find the how much the stress changes across the elastic region, then divide this by how much the strain changes across the elastic region. 2) graph only the data from the elastic region and use the spreadsheet to fit a line to the data. Don’t forget to ask your instructor or TA for help if you need it.
Write the change in stress across the elastic region here:__________
Write the change in strain across the elastic region here:__________
Show your work in calculating the slope below:
Write your slope here:_______________. The slope of the elastic region is the elastic modulus.
Conclusion
Was your hypothesis about the elastic modulus of rubber bands and tendons supported by your data? Explain.