
1.24: Big Bang Nucleosynthesis - Observations


- Last updated
- Mar 5, 2025
- Save as PDF

( \newcommand{\kernel}{\mathrm{null}\,}\)
The build-up of the chemical elements
We usually think of heavy elements as a product of nucleosynthesis (formation of nuclei) in stellar fusion and supernovae. Over billions of years of stellar processing and an overall increase in heavy element abundances, the chemical abundances of stars become richer with elements besides hydrogen, such as helium, oxygen, and iron. In a given star, we typically see a direct correlation between its oxygen abundance and iron abundance. If a star is oxygen-rich, it is likely a newer star made from dust clouds containing heavier elements, and thus likely has a high iron content as well. We can see this relationship in Figure 1, which plots the oxygen and iron content of many stars. This observed relationship supports our hypothesis that these elements were formed together over time with stellar processing.
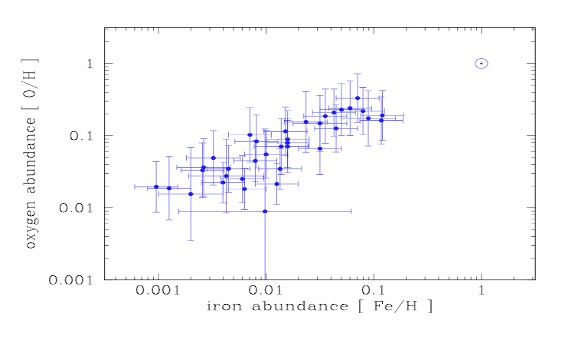
Figure 1.24.1: Relative abundances of oxygen-to-hydrogen and iron-to-hydrogen. We see a trend in which low-iron stars tend to have low-oxygen, while iron-rich stars are also oxygen-rich. This is because iron and oxygen were formed together over billions of years of stellar processing.
Observations of helium abundances gives us a different relationship, which can be seen in Figure 2. As with iron and oxygen, an oxygen-rich star is likely to contain more helium, which indicates that both helium and oxygen have been created over time with stellar processing. The difference is that we see a significant abundance of helium even in very old stars formed by gas clouds containing little to no heavy elements. This points to a primordial abundance of helium that existed even before stellar processing. Where did this helium come from?
Figure 1.24.2: Relative abundances of oxygen-to-hydrogen and helium-to-hydr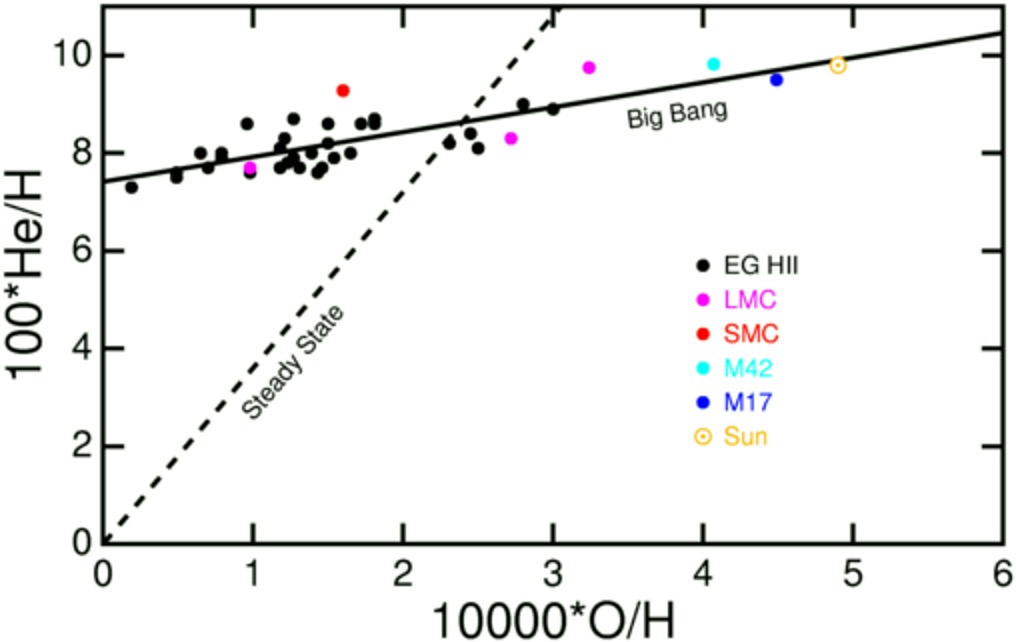 ogen in stars. While there is still a trend in which stars with low O/H also have lower He/H, even the most oxygen-poor stars contain a significant abundance of helium. This is because all these objects formed with a primordial abundance of helium, whereas there is essentially no primordial abundance of oxygen. (credit: Ned Wright)
In 1948, Gamow explored the very early universe as a source of elements heavier than hydrogen. He extrapolated Einstein’s theory of an expanding universe with certain assumptions of what the universe is made of, and concluded that the universe was infinitely dense at a finite time in the past. He theorized that this early universe could be a prodigious source of heavier elements. If the universe began at infinitely high density and temperatures and underwent rapid expansion and cooling, atomic nuclei would form within a window of just a few minutes. Before this window, high-energy radiation did not permit any nuclei to survive, and after this window, temperatures were too low for the nuclear collisions to overcome the Coulomb repulsion.
Gamow’s important discovery was that in order to avoid overproduction of helium and other heavy elements, the ratio of nucleons to photons had to be small. Since the number of photons in black body radiation is proportional to temperature cubed, this means that the “Big Bang” had to be very, very hot. From these parameters, Gamow theorized that we should see a background of heat and light from this period of high temperature and photon density. This background was discovered later in 1964 and is known as the Cosmic Microwave Background.
The Ashes of the Big Bang
Gamow's (and soon after, Ralph Alpher's) realization that chemical elements could be made during the early Universe paved the way for what is now referred to as Big Bang nucleosynthesis, which is the end-product of putting neutrons and protons in a hot, expanding universe. The original motivation of their work was to explain the origin of the abundance of all chemical elements, including hydrogen, helium, and all heavy elements. However, a few physical processes were neglected in their calculation, and as a result, the calculations by Alpher and Gamow produced orders of magnitude too many elements heavier than lithium, but roughly the correct amount of helium. In Chapter 23: Big Bang Nucleosynthesis - Predictions, we derived the amount of helium produced during the Hot Big Bang under some simplifying assumptions. Detailed calculations that include a full nuclear reaction network and all of the relevant physical processes can be used to estimate the complete set of nuclides that are created during these first few moments.
Only the lightest elements of the periodic table were made during Big Bang nucleosynthesis, including hydrogen (H), helium (He), and a trace amount of lithium (Li). The relative amounts of these nuclides depend on a competition between the expansion rate of the Universe and the rates of a network of nuclear reactions. This competition is parametrized by the relative number density of baryons to photons, commonly referred to as the baryon-to-photon ratio. Numerical calculations of these primordial nuclides have allowed us to understand the sensitivity of each primordial nuclide to the physics of the early Universe. For example, if there were an additional particle outside of the Standard Model, this might change the expansion rate of the Universe or interact with baryons in a way that changes the production and destruction of the primordial nuclides. Turning this statement around, if we could measure the relative abundance of the primordial elements, and combine this with a model of Big Bang nucleosynthesis, then we can learn about particle physics and cosmology a few minutes after the Big Bang.
The challenge is to find places in the Universe that have not significantly altered the primordial nuclides from their initial abundances set a few minutes after the Big Bang. This usually means that we have to find environments that have very few of the elements made by stars (e.g. oxygen, iron). Historically, the goal is to measure the number density of one primordial nuclide relative to hydrogen (i.e. the protons that are left over following Big Bang nucleosynthesis). While many nuclides are made during Big Bang nucleosynthesis, only the most abundantly produced primordial elements can currently be measured, including: deuterium (D, which is a heavy isotope of hydrogen), helium-3 (3He), helium-4 (4He), and lithium-7 (7Li). We will discuss the current techniques and measurements of each of these primordial elements in turn.
Deuterium: A way to weigh the Universe
Deuterium is a heavy stable isotope of hydrogen, and Big Bang Nucleosynthesis makes just ∼25 deuterons for every one million protons (a deuteron is the nucleus of a deuterium atom). The nucleus of deuterium contains one neutron and one proton, and it has very similar energy levels to the hydrogen atom. However, as a result of the neutron in the nucleus, the energy levels of a deuterium atom are shifted relative to that of hydrogen. This presents us with a problem, because if we want to measure the relative number of deuterium and hydrogen atoms of a pristine environment, we need to detect the atomic transitions of both deuterium and hydrogen. To estimate this shift, we can consider the Bohr model of the atom. The energy levels based on this model are given by: 1λ=R(1n2f−1n2i)where λ is the wavelength of the transition between levels nf and ni and R is the Rydberg constant of that atom. Since deuterium has an extra neutron in the nucleus, this changes the centre of mass of the atom, so the Rydberg constant is slightly different for deuterium and hydrogen. The ratio of the deuterium and hydrogen wavelengths is just the ratio of their Rydberg constants, which is simply the ratio of the reduced masses: λDλH=RHRD=1+memD1+memH where me, mH and mD are the rest masses of the electron, proton and deuteron. The isotope shift, expressed as a velocity shift, is c(λD−λH)/λH≃−81.6 km s−1. So, if we want to detect deuterium and hydrogen transitions, we require that the environment must not contain Doppler motions that exceed this value.
In 1976, it was realized that there might be clouds of gas in the high redshift Universe that have very low Doppler motions, such that absorption by deuterium and hydrogen transitions could be imprinted on the light of a bright, unrelated background light source. The idea is similar to looking at a lighthouse on a foggy night. We know that there is fog between us and the lighthouse because we don't see all of the light from the lighthouse. The brightest "lighthouses" in the early Universe are quasars, which are rapidly accreting supermassive black holes in the centers of galaxies. By obtaining a spectrum of a quasar, we can study the clouds of gas that are between our telescopes and the distant quasars. Furthermore, because the Universe is expanding, the absorption lines of all these gas clouds are redshifted by different amounts, leading to a plentiful forest of absorption lines (between a wavelength of 3500−4800 in the example shown in Figure E); the absorption lines in this figure are almost entirely due to hydrogen atoms that are along the line-of-sight to the quasar.
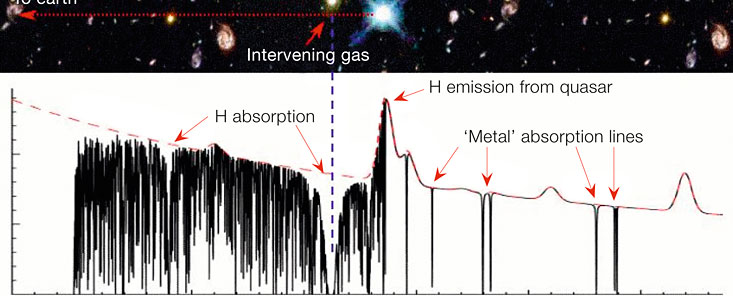
Figure 1.24.3: A spectrum of a quasar is shown (black data). Galactic and intergalactic gas along the line-of-sight to this quasar absorb the quasar light at the wavelengths corresponding to atomic transitions. The expansion of the Universe causes these transitions to redshift relative to each other, leading to a forest of absorption lines, mostly comprised of hydrogen lines. There are also some absorption lines from heavy elements, called "metals", including oxygen and iron (credit: John Webb).
In some quasar spectra, there could be as many as several hundred hydrogen absorption lines, and all of these gas clouds have deuterium atoms in them as well. However, most of these gas clouds have Doppler motions that exceed the isotope shift of 81.6 km s−1, and cannot be used to measure the relative number of deuterium and hydrogen atoms. While this technique (called "quasar absorption line spectroscopy") was very promising, it took more than two decades of research and the advent of the 10 meter diameter Keck telescopes to find the first gas clouds where deuterium and hydrogen atomic transitions could be measured. An example of the deuterium and hydrogen absorption lines detected in a gas cloud using this technique is shown in Figure 4, where the transitions from from principal quantum number n=1 to higher energy levels (a.k.a. the Lyman series of hydrogen and deuterium) are shown.
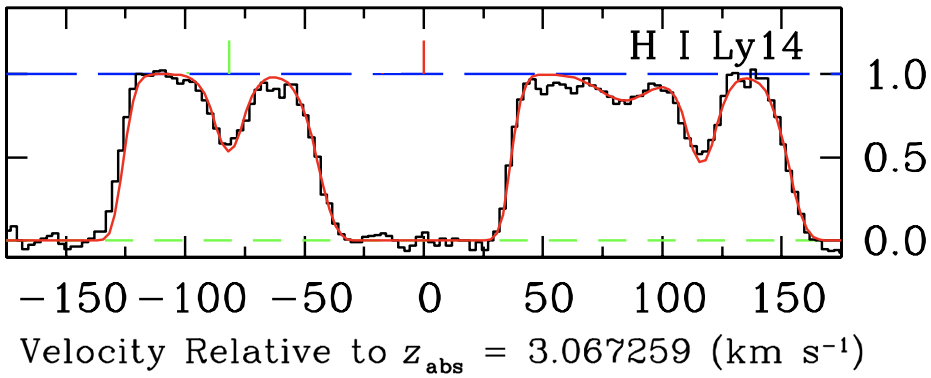
Figure 1.24.4: The black data shows an example of a deuterium and hydrogen absorption line system. The deuterium absorption is indicated with the green line at −81.6 km s−1, and the hydrogen line is shown with the red tick mark above the data. The red curve is a model fit to the data (black histogram). (credit: Ryan Cooke).
These same gas clouds also contain absorption lines from heavy elements (see Figure 3 for an example). This tells us that these gas clouds are not pristine reservoirs that have been untouched since the Big Bang; instead, their chemistry has been slightly altered by enrichment from stars. By measuring how many metals have been made relative to hydrogen in these environments, we can estimate how contaminated these environments are.
Since these first measurements were made, the technique used to identify these deuterium absorption systems has been refined. However, despite considerable work since the year 2000, the deuterium abundance has only been reliably and consistently measured for just seven gas clouds, demonstrating how challenging and rare this measurement is. These seven measurements are shown as the blue symbols in Figure 5, as a function of the amount of contamination by stars (represented by the oxygen abundance, [O/H]). Even though these seven independent gas clouds have had a different amount of stellar processing, they are all statistically consistent with each. This tells us that the gas clouds where these measurements were made have retained a primordial relative composition of deuterium and hydrogen, and their ratio is the same as the value set just minutes after the Big Bang.
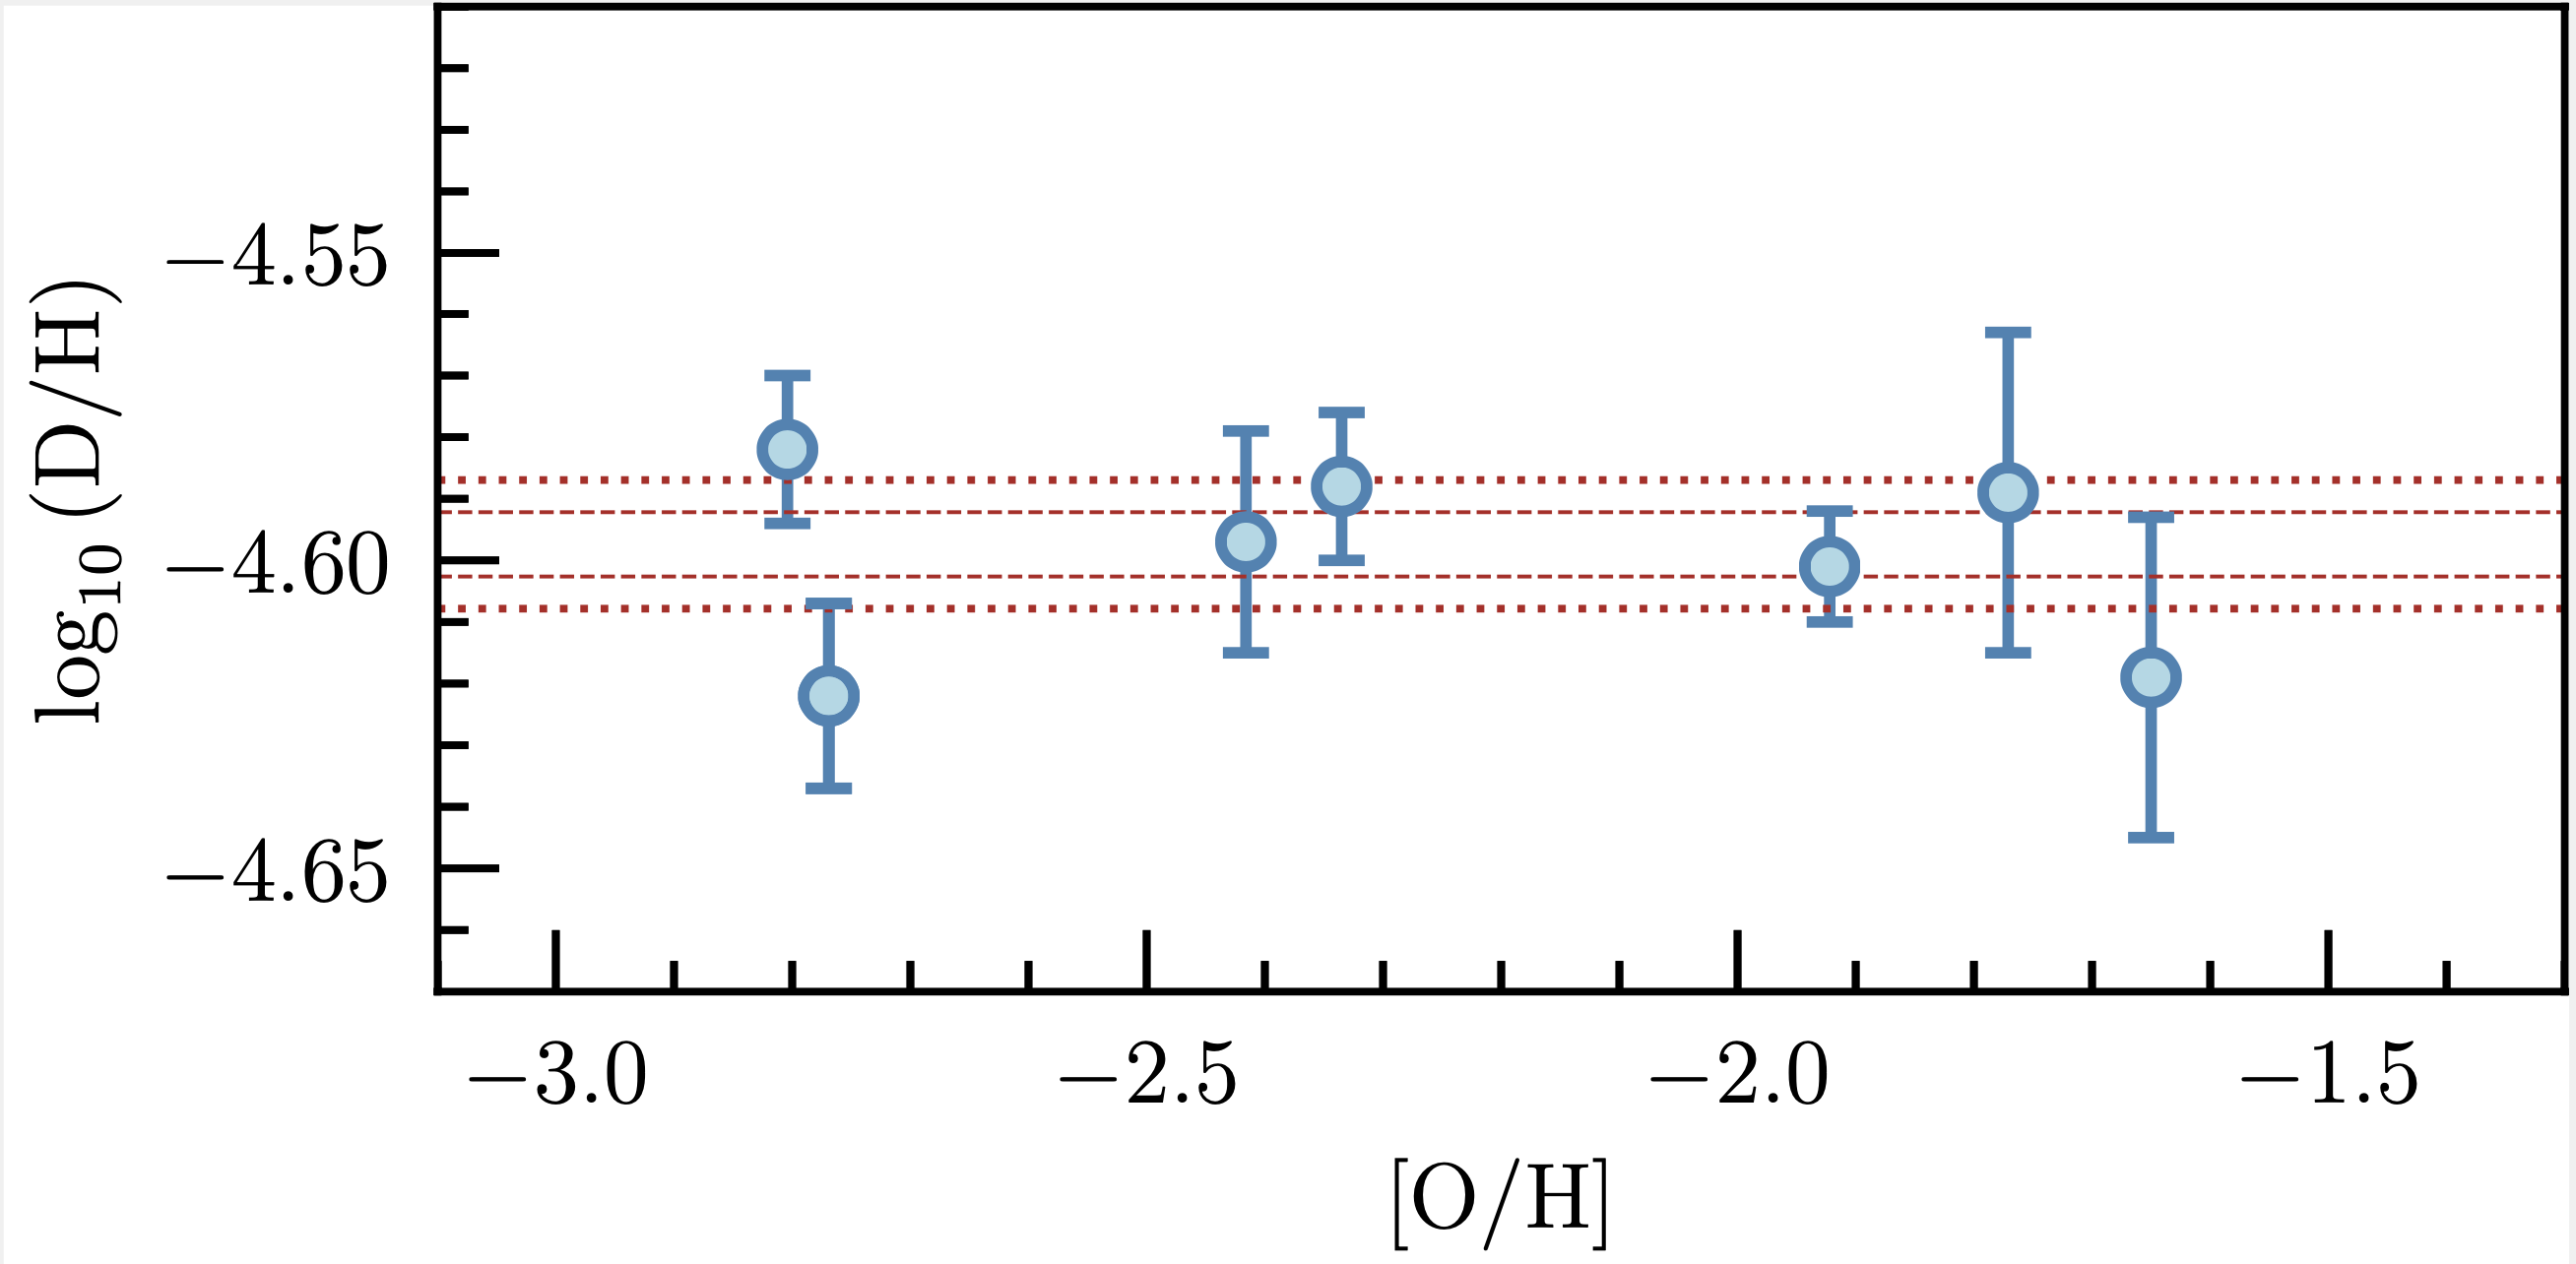
Figure 1.24.5: Seven independent measures of the deuterium abundance (i.e. the relative number of deuterium to hydrogen atoms) of gas clouds (blue symbols with error bars). The x-axis shows the oxygen abundance, displayed on a log scale relative to solar (i.e. -2 is one-hundredth of the number of oxygen atoms in the sun relative to hydrogen, while -3 represents one-thousandth of the number of oxygen atoms). All seven measures are consistent with each other. The red horizontal lines represent 68 and 95 per cent confidence interval of the weighted mean value of these seven measures. (credit: Ryan Cooke).
Calculations of Big Bang nucleosynthesis indicate that the relative abundance of deuterium and hydrogen atoms is highly sensitive to the expansion rate of the Universe and the density of baryons (i.e. ordinary matter). If we assume the Standard Model of particle physics and cosmology, this sets the expansion rate of the Universe, and under this assumption, we can use the deuterium abundance to estimate the universal density of baryons. The baryon density is also a fundamental quantity that can be measured from the cosmic microwave background temperature fluctuations. Quite amazingly, the baryon density that is inferred from the seven measures of D/H agrees with the baryon density derived from the cosmic microwave background at one per cent precision. The astounding agreement of these two baryon density measures, based on completely independent physics, and based on two epochs of the Universe separated by almost 400,000 years, represents one of the strongest confirmations of our Standard cosmological model.
Helium-4 and the search for physics beyond the Standard Model
As discussed in Chapter 23: Big Bang Nucleosynthesis - Predictions, 4He is the main nuclide produced during Big Bang nucleosynthesis. Calculations of Big Bang nucleosynthesis tell us that the amount of 4He that is made depends primarily on the expansion rate of the Universe. There are three approaches to measure the primordial abundance of 4He: (1) spectroscopic observations of metal-poor star-forming dwarf galaxies; (2) quasar absorption lines; and (3) the damping tail of the Cosmic Microwave Background temperature fluctuations. These approaches will now be discussed in turn.
Galaxies that are currently forming a new generation of stars are referred to as "star-forming galaxies", and usually have blue colors owing to the presence of massive (and therefore short-lived) stars of spectral type O and B. These hot stars produce significant quantities of photons that are capable of ionizing the atoms in the surrounding area. Electrons that have been ionized from atoms eventually recombine with another atom and produce emission lines as the electron cascades down the energy levels. An image and a spectrum of one of the most metal-poor star-forming galaxies currently known is shown in Figure 6; this galaxy is called I Zwicky 18 (where the "I" is the roman numeral for 1, and is pronounced "one Zwicky eighteen"). The ionized gas surrounding the O and B stars are generally referred to as "H II regions", because almost all of the hydrogen atoms have had their electron ionized ("H I" refers to regions that are mostly neutral, whereby most of the protons have captured an electron).
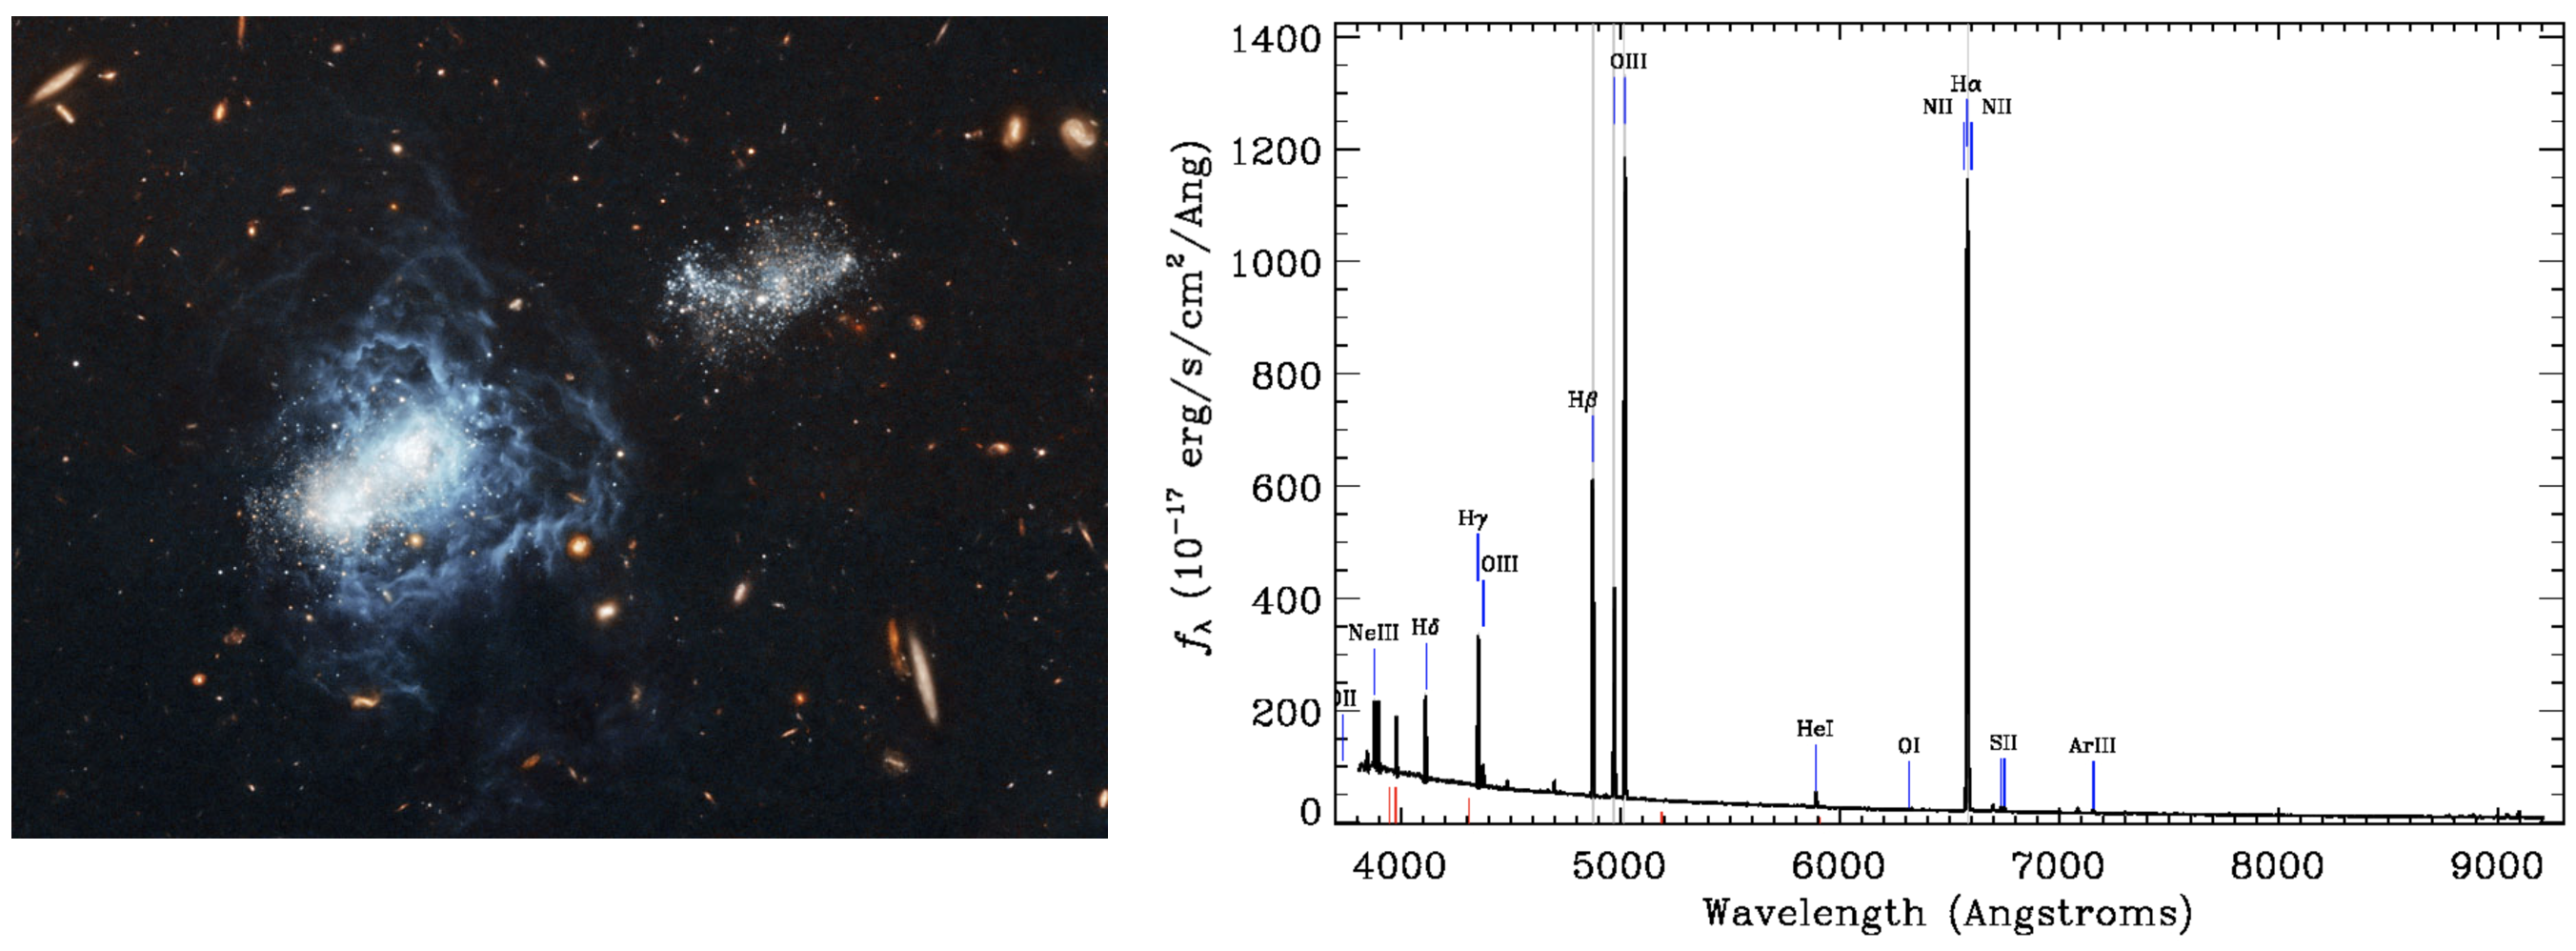
Figure 1.24.6: An image of I Zwicky 18 (left panel; credit: NASA, ESA, and A. Aloisi) and an optical spectrum (right panel; credit: SDSS). Note the blue appearance of the galaxy image and the emission lines that are detected in the spectrum, indicating that hot O and B stars are ionizing the gas in this galaxy. The relative strengths of the emission lines can tell us about the physical and chemical properties of the gas.
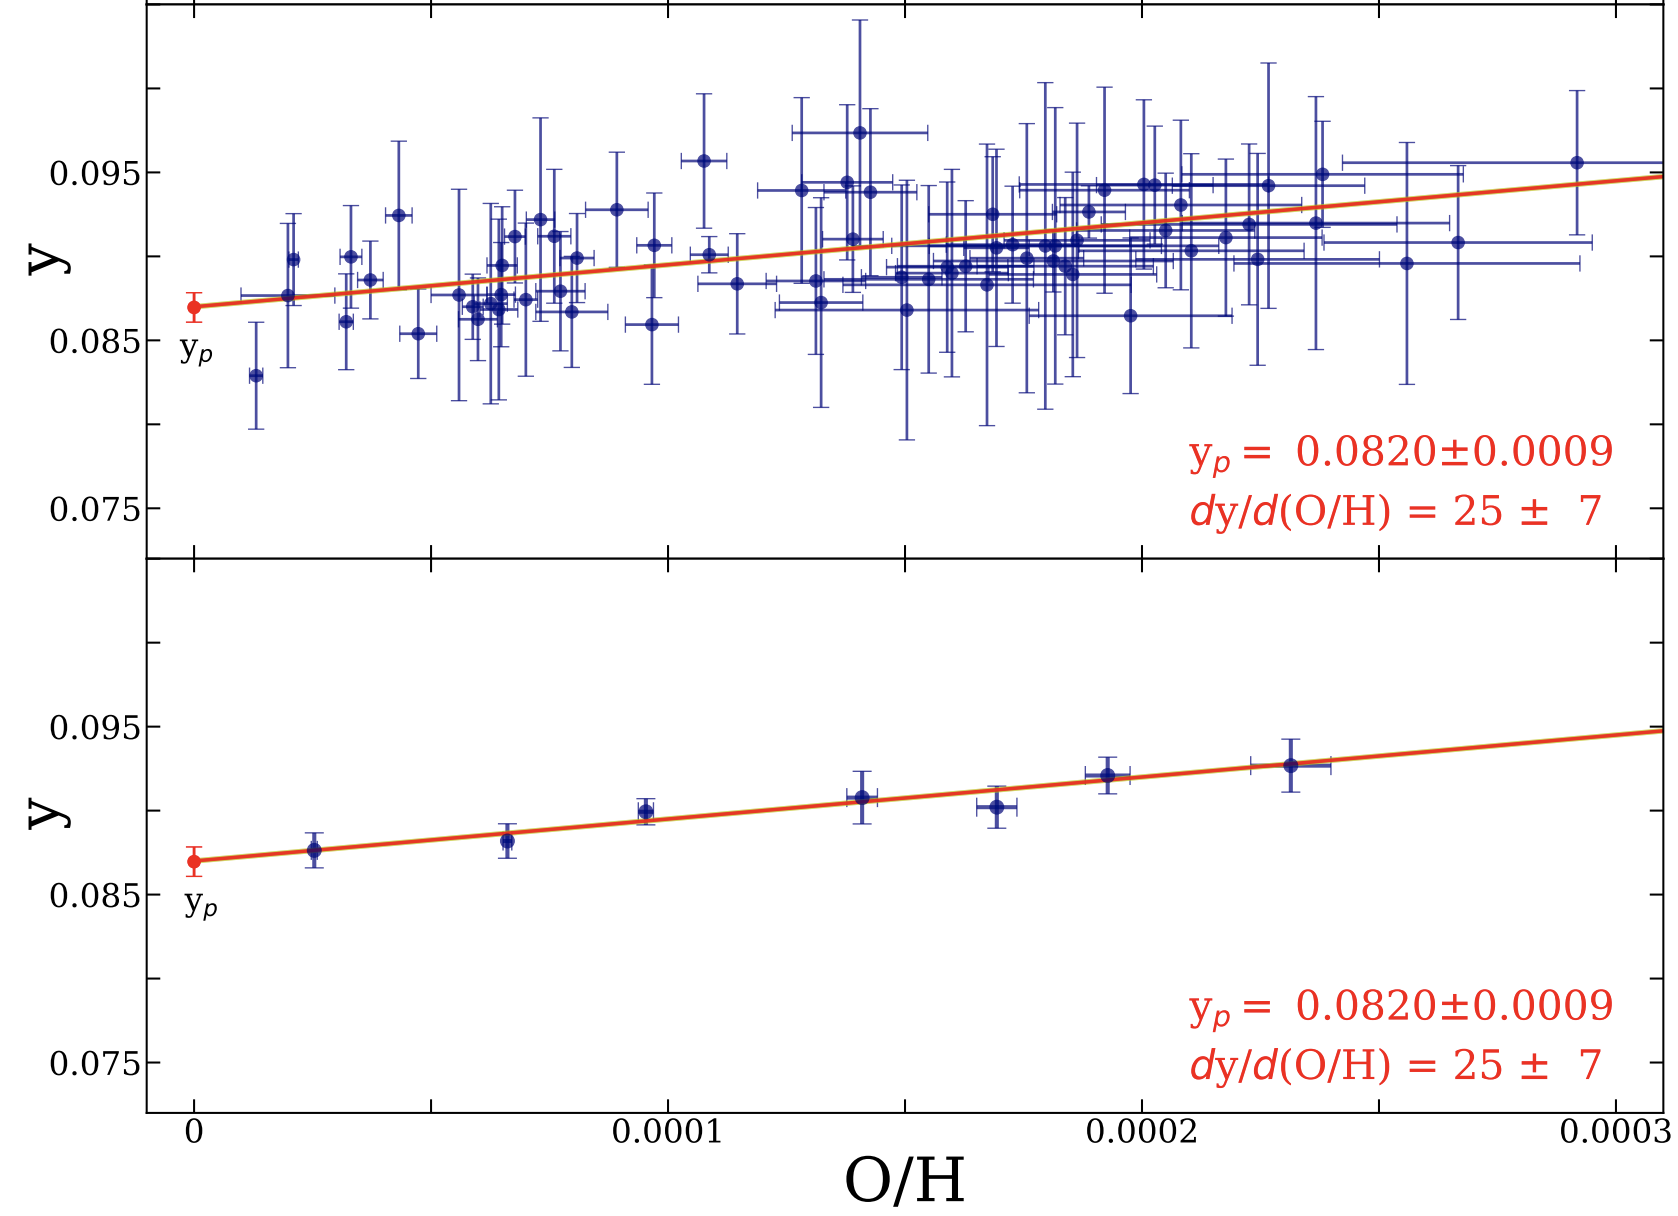 Figure 1.24.7: The helium abundance of a sample of galaxies with different metallicities (measured as O/H) shows a gentle increase from the primordial value, yp (credit: O. A. Kurichin).
The relative strengths of the emission lines emanating from H II regions depend on the chemistry of the gas (i.e. the relative abundance of each chemical element) and the physical conditions of the gas (e.g. the density, temperature, ionization fraction, etc.). Most of the emission lines that come from H II regions have a different dependence on density, temperature, etc. and by combining the information from many lines simultaneously, it is possible to determine both the physical and chemical properties of the gas. Measurements of the 4He/H ratio in different galaxies indicate that the 4He abundance gradually increases as stars produce heavy elements (see Figure 2). Therefore, the helium abundance that we measure in these star-forming galaxies does not reflect the primordial composition. Instead, we need to measure the helium abundance in many galaxies covering a range of metallicity, fit a linear relation to the helium and metal abundance, and extrapolate this linear fit to zero metallicity (see Figure 7). Current determinations of the primordial helium abundance using this approach are limited by systematic uncertainties at the ∼1 per cent level.
The second approach that has been used to infer the primordial helium abundance uses quasar absorption line spectroscopy (see the section on Deuterium, above, for an explanation of this technique) of metal-poor gas clouds at high redshift (z∼1−2). This approach is qualitatively similar to the approach used to measure the deuterium abundance, however, there is a key difference between these approaches. For deuterium, one tries to find mostly neutral gas clouds to facilitate the detection of many deuterium Lyman series transitions. However, these mostly neutral gas clouds absorb essentially all of the background quasar photons with energies greater than the ionization potential of hydrogen (13.6 eV ≡ 912Å). Since all of the helium transitions occur at wavelengths <912Å, there is insufficient quasar flux to detect helium absorption. Therefore, in order to detect both helium and hydrogen absorption lines, the gas cloud needs to be transparent to photons at wavelengths <912Å; this occurs for gas clouds that are mostly ionized, with a column density of neutral hydrogen N(HI)<1017 atoms cm−2. The helium abundance has only been measured in one gas cloud with a metallicity of 1/30 solar, which is a similar metallicity to the most metal-poor star-forming galaxies used to measure the helium abundance. The measurement precision of this technique is currently at the ∼10 per cent level.
The third approach that is currently employed to infer the primordial 4He abundance uses the Cosmic Microwave Background temperature fluctuations (see Chapter 27: Cosmic Microwave Background Anisotropies). For further details about this technique, see the Advanced Topic at the end of this chapter.
Lithium-7 and the Cosmic Lithium Problem
The best available observational determination of the primordial 7Li abundance is based on measurements of the 7Li absorption from the atmosphere's of metal-poor stars in the Milky Way. This is not a straightforward measurement, because stars are extremely good at burning 7Li. Convective motions (particularly in cool stars) mix the 7Li near the surface of the star into the deeper layers where 7Li is burned. Meanwhile 7Li-deficient material is brought to the surface. To mitigate this process, observations typically focus on the hottest metal-poor stars, which have thin convective zones, and the measured 7Li abundance does not correlate with temperature. This key realization came from F. Spite and M. Spite in 1982, who reported the first measurement of the 7Li abundance in metal-poor stars; using only the hottest halo stars, Spite & Spite found that the 7Li abundance of these stars is independent of temperature and metallicity, and has a very small scatter. This seemingly constant 7Li abundance is referred to as the "Spite Plateau" (see Figure 8), and this value has remained impressively constant over the last few decades.
For many years, it was assumed that the Spite plateau was representative of the primordially produced abundance of 7Li/H. However, at the turn of the millennium, the first WMAP results provided an impressively tight bound on the baryon density, and this revealed that the Spite plateau disagreed significantly with the Standard Model value, based on the CMB-derived baryon density. This problem has come to be known as the "Cosmic Lithium Problem". Many groups have re-measured the lithium abundance with increasing detailed models of stellar atmosphere's, and the result was essentially unchanged (actually this made the agreement with the Standard Model a little worse). Several nuclear physics groups searched for resonances with the reaction rates involving 7Li, with the expectation that an unidentified resonance might alter the primordially predicted 7Li abundance; the refined measurements of the reaction rates made the disagreement even more pronounced.
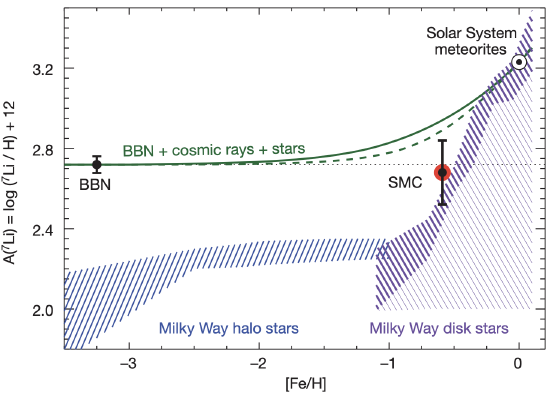 Figure 1.24.8: The chemical evolution of 7Li in the Milky Way. The x-axis shows the iron abundance on a log scale relative to solar (i.e. 0 is the solar iron abundance, -1 is one-tenth solar, etc.). The primordial 7Li abundance assuming the Standard Model is shown by the black symbol with error labeled "BBN". As the Universe becomes more enriched with iron, some 7Li is made by stars and cosmic rays. The build-up of 7Li as the iron abundance increases is shown by the green solid line, and the solar value is given by the ⊙ symbol. The measured value in stars is shown by the purple and blue hatched region. The "Spite Plateau" refers to the roughly constant value of 7Li/H between -2.5 < [Fe/H] < -1.0. At extremely low metallicities, [Fe/H] < -2.5, the Spite Plateau declines. The 7Li abundance of the Small Magellanic Cloud (based on interstellar absorption line spectroscopy) is shown as the red and black symbol with an error bar (Credit: J. C. Howk).
It's fair to say that most, but far from all, of the community believe that Cosmic Lithium Problem can be solved with a better understanding of 7Li burning in stars; this is currently the favored explanation for the relatively low abundance of lithium in metal-poor stars. Moreover, several groups have now measured the 7Li abundance in extremely metal-poor stars, and found that the Spite Plateau appears to break down at metallicities less than 1/300th of solar (see Figure 8), giving further weight to the idea that the Cosmic Lithium Problem is a result of stellar burning of 7Li. In an attempt to mitigate the problem of 7Li burning in stars, a measurement of the interstellar abundance of 7Li was made in the lowest metallicity environment where this measurement is currently possible - the Small Magellanic Cloud (SMC), which has an iron abundance about one-fifth of the solar metallicity. The technique used is similar to quasar absorption line spectroscopy (see description in the section on deuterium, above), but instead of a quasar, a bright O star is used as the background light source probing the interstellar medium of the galaxy. Coincidentally, this measurement is consistent with the Standard Model primordial value; however, we expect that the interstellar medium of the Small Magellanic Cloud is enriched with some 7Li made by stars and cosmic rays. Subtracting the 7Li produced by stars and cosmic rays in the Small Magellanic Cloud would result in a value that is consistent with the Spite Plateau, and marginally inconsistent with the Standard Model value. Thus, further work is needed to elucidate the cosmic chemical evolution of 7Li, and pin down with confidence an observational determination of the primordial 7Li abundance.
Helium-3
3He has proven to be a very challenging primordial nuclide to measure. First, almost all 3He and 4He transitions are very close in wavelength (the difference is one neutron in the nucleus - see the section above on deuterium for a discussion about isotope shifts). The proximity of these transitions, and the fact that 4He is 10,000 times more abundance than 3He, has rendered measurements of the 3He abundance to be nearly impossible. To date, 3He has only been measured in the Milky Way, including a small handful of H II regions and a few environments in our Solar System (Jupiter, in particular, provides a good estimate of the pre-solar 3He/4He abundance). Unfortunately (for measurements of the primordial abundances), the Milky Way has experienced a significant amount of chemical enrichment, and the 3He abundances measured in the Solar System and in some of the Milky Way H II regions do not reflect the primordial value. Nevertheless, despite the significant build-up of metals in the Milky Way, the latest models of Galactic chemical evolution suggest that the abundance of 3He in the outskirts of galaxies like the Milky Way may be close to primordial (see the red curve in Figure 9).
The most common approach currently used to infer the primordial 3He abundance utilizes the 8.7 GHz spin-flip transition of 3He+ (i.e. singly ionized 3He). The key benefit of this approach is that 3He has a non-zero nuclear spin, while the nuclear spin of 4He is zero. The ground state of 3He is therefore split into two hyperfine structure levels; this splitting does not occur for 4He, so the detection of 3He in emission is made somewhat less difficult. Over many decades of work, there are just five reliable measurements of the 3He abundance in Galactic H II regions. The most distant, and well-characterized of these H II regions is called "S209", and is 16 kpc from the Galactic centre, where models of Galactic chemical evolution predict a very modest enhancement in the amount of 3He above the primordial value (see Figure 9). The value measured in this H II region agrees with the Standard Model value to within ∼30 per cent.
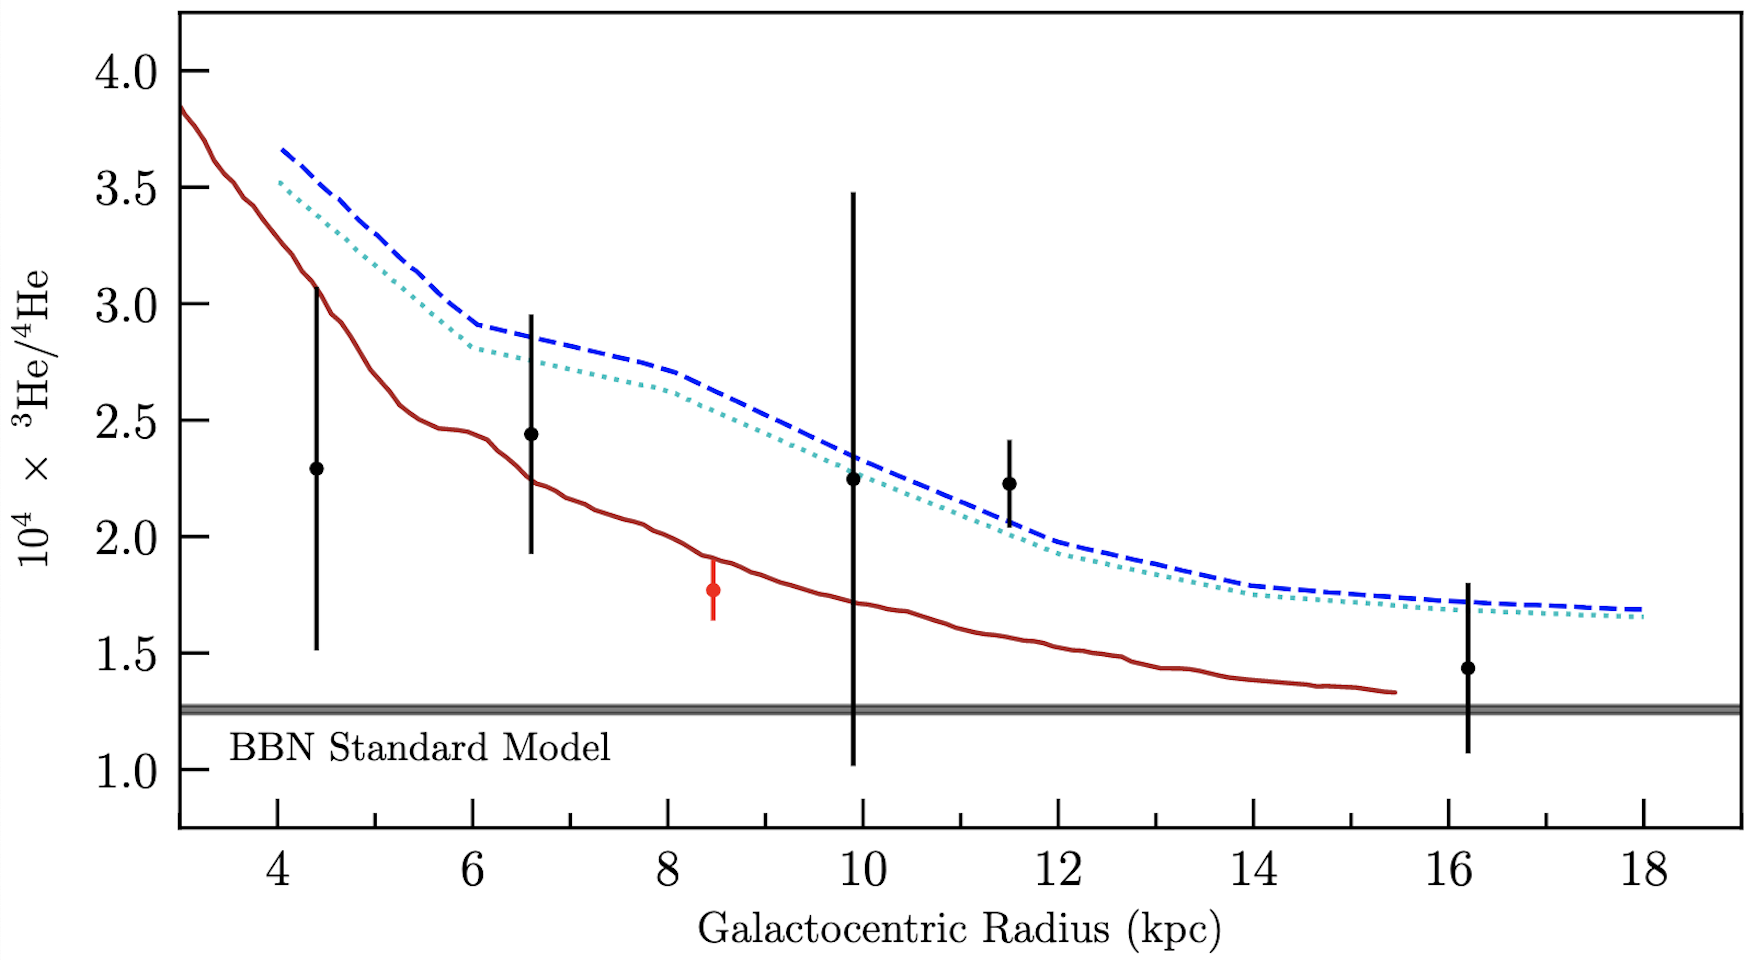
Figure 1.24.9: The present-day radial distribution of 3He in the Milky Way (symbols with error bars) together with a detailed model of Galactic chemical evolution (red curve) and the primordial abundance (gray horizontal band labeled "BBN Standard Model"). The blue curves show Galactic chemical evolution models that do not include outflowing gas. The black points correspond to measurements of the 8.7 GHz fine-structure line of 3He+, while the red symbol represents a measure of the 3He/4He isotope ratio of the Orion Nebula, using absorption line spectroscopy (Credit: R. Cooke).
An alternative approach uses the same 8.7 GHz transition to detect 3He+ in absorption against the light of a radio-bright background quasar close to helium reionization at redshift z≃3.5. While the astronomical telescope facilities do not currently exist to perform this measurement, this is an exciting goal for future facilities, because the intergalactic regions that would be probed with this technique are almost certainly of near-primordial composition.
Finally, a recent measurement of the helium isotope ratio of the Orion Nebula was reported using absorption line spectroscopy of a star in Orion to study the gas that lies at the edge of the Orion Nebula. This approach is qualitatively similar to the approach used to measure the deuterium abundance of gas clouds at high redshift (see the section on the deuterium abundance above for a discussion about this approach). Future measurements using this technique may help to precisely pin down the Galactic chemical evolution of 3He, and also obtain a determination of the primordial helium isotope ratio from the outskirts of the Milky Way. It is also possible to apply this technique to gas clouds at higher redshift, where the Universe has had less time to pollute the primordial signature.
Advanced Topic - Helium-4 and the Cosmic Microwave Background
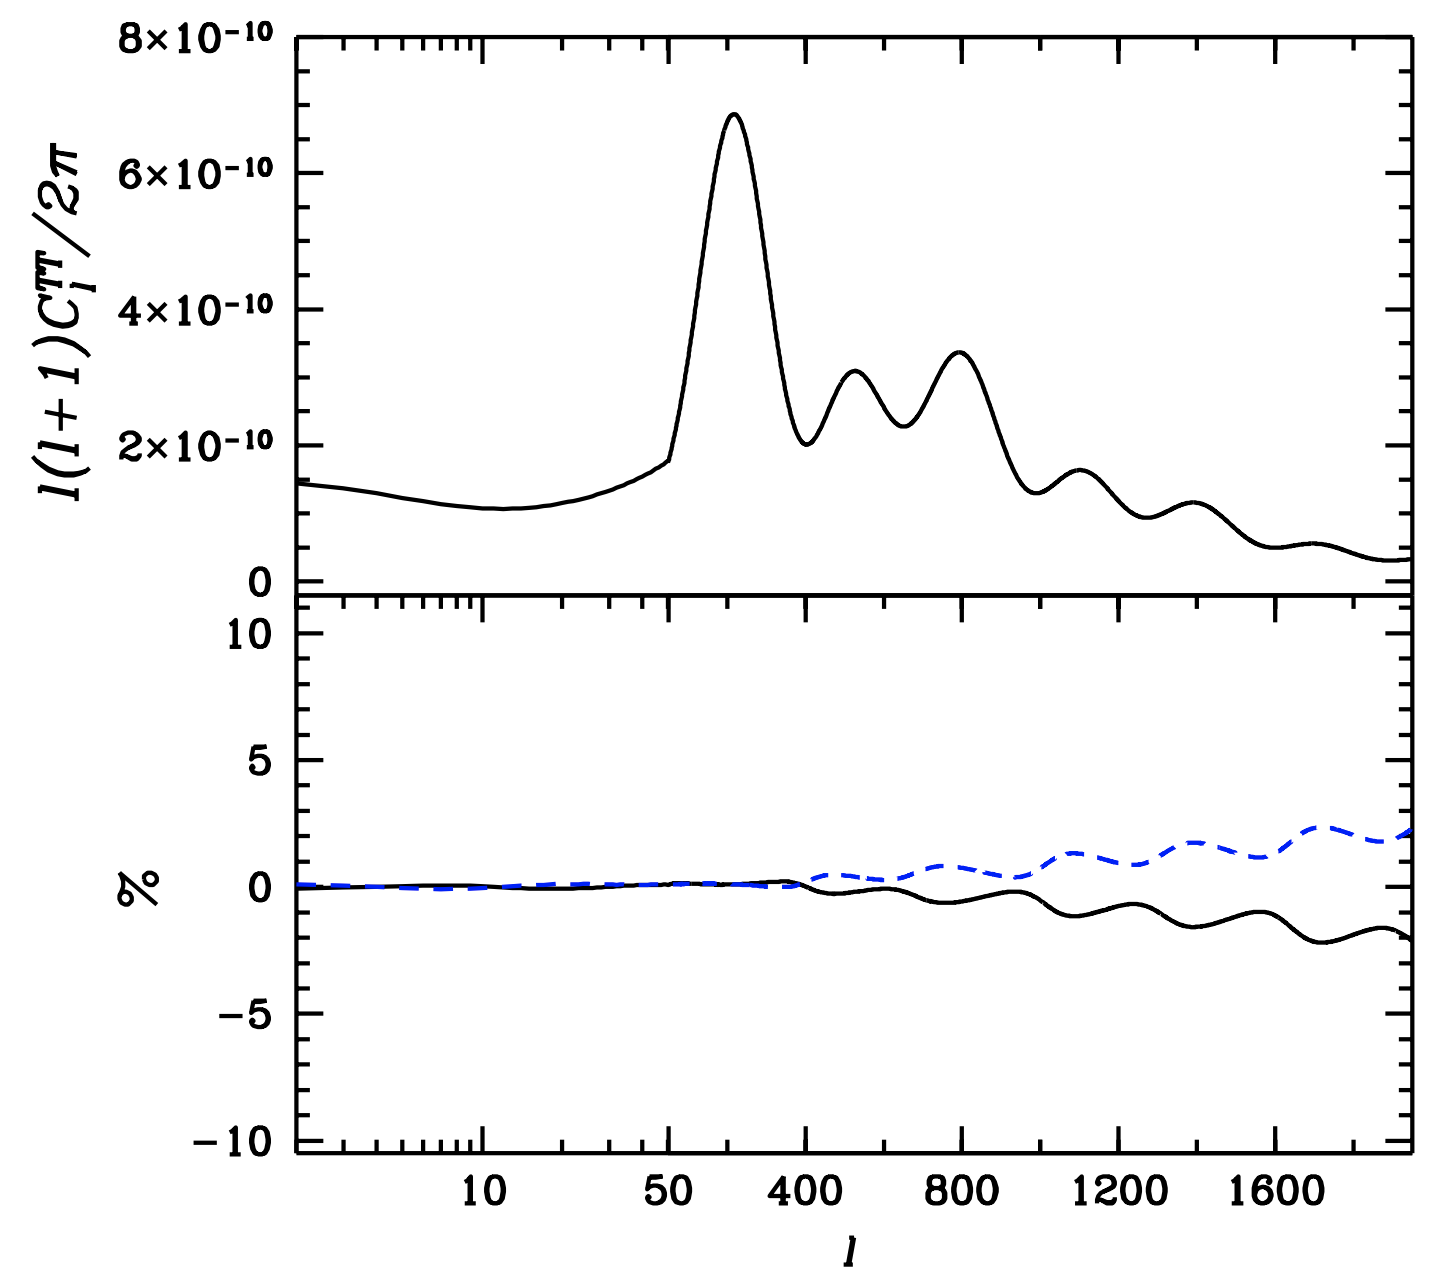
Figure 1.24.10: The power spectrum of the Cosmic Microwave Background radiation (top panel), and the deviations of the power spectrum (in per cent) due to changes of the helium abundance. The blue dashed and solid black lines represent a decrease and increase of the primordial helium abundance by 10 per cent. (credit: Trotta & Hansen 2003).
An alternative and very promising approach to measure the helium abundance utilizes the power spectrum of temperature fluctuations imprinted on the Cosmic Microwave Background radiation. This approach has the advantage that helium is purely primordial during recombination, because there are no channels (i.e. stars) to produce/destroy 4He during the first 400,000 years after Big Bang nucleosynthesis.
The key physical process that is sensitive to the helium abundance is diffusion damping. Note also that if more 4He is produced during Big Bang nucleosynthesis, that means less hydrogen is made, and vice-versa. Diffusion damping (sometimes referred to as Silk damping) is a process whereby the temperature fluctuations are smoothed out on small scales (high multipoles). The damping is a result of photons being constantly scattered by charged particles (mostly electrons) prior to recombination. Photon scattering stops when the temperature of the Universe drops to the point that electrons can recombine with nuclei, at which point photons can free stream. Electrons recombine with helium first, followed later by hydrogen recombination; this is because helium has a higher ionization potential than hydrogen (i.e. it is more difficult to ionize an electron from helium once it has recombined). If more helium is made during Big Bang nucleosynthesis, there are fewer electrons between helium and hydrogen recombination, leading to less scattering. This allows photons to free stream further, damping the perturbations and reducing the CMB power at small scales. The effect is relatively small (see Figure 10), and the current inference on the primordial helium abundance using this approach is ∼10 per cent. Future CMB experiments that target small angular scales aim to measure this quantity to much higher precision.