
Electron Paramagnetic Resonance
- Page ID
- 788
\( \newcommand{\vecs}[1]{\overset { \scriptstyle \rightharpoonup} {\mathbf{#1}} } \)
\( \newcommand{\vecd}[1]{\overset{-\!-\!\rightharpoonup}{\vphantom{a}\smash {#1}}} \)
\( \newcommand{\dsum}{\displaystyle\sum\limits} \)
\( \newcommand{\dint}{\displaystyle\int\limits} \)
\( \newcommand{\dlim}{\displaystyle\lim\limits} \)
\( \newcommand{\id}{\mathrm{id}}\) \( \newcommand{\Span}{\mathrm{span}}\)
( \newcommand{\kernel}{\mathrm{null}\,}\) \( \newcommand{\range}{\mathrm{range}\,}\)
\( \newcommand{\RealPart}{\mathrm{Re}}\) \( \newcommand{\ImaginaryPart}{\mathrm{Im}}\)
\( \newcommand{\Argument}{\mathrm{Arg}}\) \( \newcommand{\norm}[1]{\| #1 \|}\)
\( \newcommand{\inner}[2]{\langle #1, #2 \rangle}\)
\( \newcommand{\Span}{\mathrm{span}}\)
\( \newcommand{\id}{\mathrm{id}}\)
\( \newcommand{\Span}{\mathrm{span}}\)
\( \newcommand{\kernel}{\mathrm{null}\,}\)
\( \newcommand{\range}{\mathrm{range}\,}\)
\( \newcommand{\RealPart}{\mathrm{Re}}\)
\( \newcommand{\ImaginaryPart}{\mathrm{Im}}\)
\( \newcommand{\Argument}{\mathrm{Arg}}\)
\( \newcommand{\norm}[1]{\| #1 \|}\)
\( \newcommand{\inner}[2]{\langle #1, #2 \rangle}\)
\( \newcommand{\Span}{\mathrm{span}}\) \( \newcommand{\AA}{\unicode[.8,0]{x212B}}\)
\( \newcommand{\vectorA}[1]{\vec{#1}} % arrow\)
\( \newcommand{\vectorAt}[1]{\vec{\text{#1}}} % arrow\)
\( \newcommand{\vectorB}[1]{\overset { \scriptstyle \rightharpoonup} {\mathbf{#1}} } \)
\( \newcommand{\vectorC}[1]{\textbf{#1}} \)
\( \newcommand{\vectorD}[1]{\overrightarrow{#1}} \)
\( \newcommand{\vectorDt}[1]{\overrightarrow{\text{#1}}} \)
\( \newcommand{\vectE}[1]{\overset{-\!-\!\rightharpoonup}{\vphantom{a}\smash{\mathbf {#1}}}} \)
\( \newcommand{\vecs}[1]{\overset { \scriptstyle \rightharpoonup} {\mathbf{#1}} } \)
\(\newcommand{\longvect}{\overrightarrow}\)
\( \newcommand{\vecd}[1]{\overset{-\!-\!\rightharpoonup}{\vphantom{a}\smash {#1}}} \)
\(\newcommand{\avec}{\mathbf a}\) \(\newcommand{\bvec}{\mathbf b}\) \(\newcommand{\cvec}{\mathbf c}\) \(\newcommand{\dvec}{\mathbf d}\) \(\newcommand{\dtil}{\widetilde{\mathbf d}}\) \(\newcommand{\evec}{\mathbf e}\) \(\newcommand{\fvec}{\mathbf f}\) \(\newcommand{\nvec}{\mathbf n}\) \(\newcommand{\pvec}{\mathbf p}\) \(\newcommand{\qvec}{\mathbf q}\) \(\newcommand{\svec}{\mathbf s}\) \(\newcommand{\tvec}{\mathbf t}\) \(\newcommand{\uvec}{\mathbf u}\) \(\newcommand{\vvec}{\mathbf v}\) \(\newcommand{\wvec}{\mathbf w}\) \(\newcommand{\xvec}{\mathbf x}\) \(\newcommand{\yvec}{\mathbf y}\) \(\newcommand{\zvec}{\mathbf z}\) \(\newcommand{\rvec}{\mathbf r}\) \(\newcommand{\mvec}{\mathbf m}\) \(\newcommand{\zerovec}{\mathbf 0}\) \(\newcommand{\onevec}{\mathbf 1}\) \(\newcommand{\real}{\mathbb R}\) \(\newcommand{\twovec}[2]{\left[\begin{array}{r}#1 \\ #2 \end{array}\right]}\) \(\newcommand{\ctwovec}[2]{\left[\begin{array}{c}#1 \\ #2 \end{array}\right]}\) \(\newcommand{\threevec}[3]{\left[\begin{array}{r}#1 \\ #2 \\ #3 \end{array}\right]}\) \(\newcommand{\cthreevec}[3]{\left[\begin{array}{c}#1 \\ #2 \\ #3 \end{array}\right]}\) \(\newcommand{\fourvec}[4]{\left[\begin{array}{r}#1 \\ #2 \\ #3 \\ #4 \end{array}\right]}\) \(\newcommand{\cfourvec}[4]{\left[\begin{array}{c}#1 \\ #2 \\ #3 \\ #4 \end{array}\right]}\) \(\newcommand{\fivevec}[5]{\left[\begin{array}{r}#1 \\ #2 \\ #3 \\ #4 \\ #5 \\ \end{array}\right]}\) \(\newcommand{\cfivevec}[5]{\left[\begin{array}{c}#1 \\ #2 \\ #3 \\ #4 \\ #5 \\ \end{array}\right]}\) \(\newcommand{\mattwo}[4]{\left[\begin{array}{rr}#1 \amp #2 \\ #3 \amp #4 \\ \end{array}\right]}\) \(\newcommand{\laspan}[1]{\text{Span}\{#1\}}\) \(\newcommand{\bcal}{\cal B}\) \(\newcommand{\ccal}{\cal C}\) \(\newcommand{\scal}{\cal S}\) \(\newcommand{\wcal}{\cal W}\) \(\newcommand{\ecal}{\cal E}\) \(\newcommand{\coords}[2]{\left\{#1\right\}_{#2}}\) \(\newcommand{\gray}[1]{\color{gray}{#1}}\) \(\newcommand{\lgray}[1]{\color{lightgray}{#1}}\) \(\newcommand{\rank}{\operatorname{rank}}\) \(\newcommand{\row}{\text{Row}}\) \(\newcommand{\col}{\text{Col}}\) \(\renewcommand{\row}{\text{Row}}\) \(\newcommand{\nul}{\text{Nul}}\) \(\newcommand{\var}{\text{Var}}\) \(\newcommand{\corr}{\text{corr}}\) \(\newcommand{\len}[1]{\left|#1\right|}\) \(\newcommand{\bbar}{\overline{\bvec}}\) \(\newcommand{\bhat}{\widehat{\bvec}}\) \(\newcommand{\bperp}{\bvec^\perp}\) \(\newcommand{\xhat}{\widehat{\xvec}}\) \(\newcommand{\vhat}{\widehat{\vvec}}\) \(\newcommand{\uhat}{\widehat{\uvec}}\) \(\newcommand{\what}{\widehat{\wvec}}\) \(\newcommand{\Sighat}{\widehat{\Sigma}}\) \(\newcommand{\lt}{<}\) \(\newcommand{\gt}{>}\) \(\newcommand{\amp}{&}\) \(\definecolor{fillinmathshade}{gray}{0.9}\)Electron Paramagnetic Resonance (EPR), also known as electron spin resonance (ESR), is a spectroscopic technique used to investigate paramagnetic (unpaired electron) compounds. Electrons, like nuclei*, have charge and spin and therefore have a magnetic moment and are susceptible to a magnetic field. EPR measures the energy of spin transitions when unpaired electrons are in a magnetic field. The energy will lead to the characteristic g-factor for the molecule being analyzed. This technique is analogous to nuclear magnetic resonance (NMR), but the electron has a much larger magnetic moment and a larger energy gap for spin transitions than nuclei.
EPR was first performed by the Clarendon Laboratory in Oxford, England in 1945. Using a 25 meter wavelength spectrometer Zavoisky was able to detect faint signals corresponding to multiple paramagnetic species1. Improvements in microwave generation coinciding with World War II radar development allowed EPR to quickly reach a near-theoretical limit of sensitivity in only a matter of a few decades. Since then it has become a work horse technique for a wide varety of chemistry disciplines.
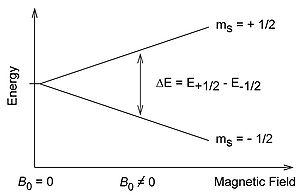
Free electrons possess an intrinsic angular momentum called spin (S) that generates a magnetic field through the charge of the electron. From a classical understanding the free electron has a magnetic dipole with a magnetic moment \mu\. Without the presence of an external magnetic field, the directions of the magnetic moment are degenerate in energy. The introduction of the magnetic field B0 breaks the degeneracy of the magnetic moment which is observed through the Zeeman Effect.
The magnetic moment of the electron is proportional to the spin projection:
\[\mu _{e}=-g_{e}\mu _{B}M_{S}\]
\(\mu\) is the Bohr magneton which is equal to 9.274*10-24 J/T and ge is the spectroscopic g-factor. The ge for the free electron is known, with high precision, to be 2.0023192778. Typical paramagnetic organic compounds tend to have g-factors ranging between 1.99 and 2.01 - however transition metals have a much larger range. The g-factor is unique to each type of paramagnetic center - and can be used to identify an unknown.
External Magnetic Field
Quantum mechanics shows that the electron spin is quantized to be \(\dfrac{1}{2}\) times planck's constant (which is widely omitted for simplicity). In the presence of an external field along the z-axis, the projection of the spin, Ms, oriented along the z- axis can only take on the values \(\pm\dfrac{1}{2}\). The positive Ms corresponds to a antiparallel orientation to the field and a negative value indicates a parallel orientation to the direction of the field. The energy difference after the degeneracy is broken is:
\[\Delta E= g\mu _{B} B_{0}\]
Beginning with the Hamiltonian for electron spin we have:
\[{\hat{H}}= -B\hat{\mu }_z\]
\[{\hat{\mu }}_{ez}=\ {\gamma }_e{\hat{S}}_zh=\ -g{\mu}_B{\hat{S}}_z\]
\[{\hat{\mathcal H}}_e=\ g_e{\mu}_{B}\hat{S_z}\]
We see our expression for \(\Delta E\) for the spin transition.
Microwave Frequencies
When a photon of energy equal to \(\Delta E\) is absorbed, the electron transitions to the higher energy state. The energy of this transition is similar in magnitude to microwave radiation. This gives two options for spectroscopy: either the magnetic field can be fixed and the photon energies can be changed, or the photon energy can be fixed and the magnetic field varied. Technological limitations make it easier to keep the microwave source (usually a klystron) fixed. The approximate microwave band frequencies and names are given in the table below:
| Band | Frequency (GHz) |
|---|---|
|
L |
1 |
| S | 3 |
| X | 9.4 |
| P | 15 |
| K | 18 |
| Q | 35 |
| W | 94 |
Generally, spectra are better resolved at higher frequencies.
Detection
Microwaves propagate to the sample located in a resonator between the two poles of an electromagnet. The resonator size is chosen such that a standing wave is formed with a maximal energy density at the sample position. Likewise, the sample location is such that there is the most uniform external magnetic field. Detectors for EPR employ phase sensitivity and noise reduction techniques to filter out the unwanted (not at the constant value) photon frequencies. Likewise, an additional magnetic modulation field is applied in the resonator to boost resolution - as a result change in absorption is measured relative to the modulation field which gives a first derivative spectrum.
Furthermore, as spin populations can be related by the Maxwell-Boltzmann distribution, EPR is normally performed at low temperatures (10-15 K) to ensure that excitation and absorption are the most probable events. The ground state (n0) population available to be EPR observable is shown by:
\[\dfrac{n_{1}}{n_{0}}=e^{-\dfrac{\Delta E}{KT}}\]
Keeping T as low as possible results in a large n0, producing a large EPR signal.
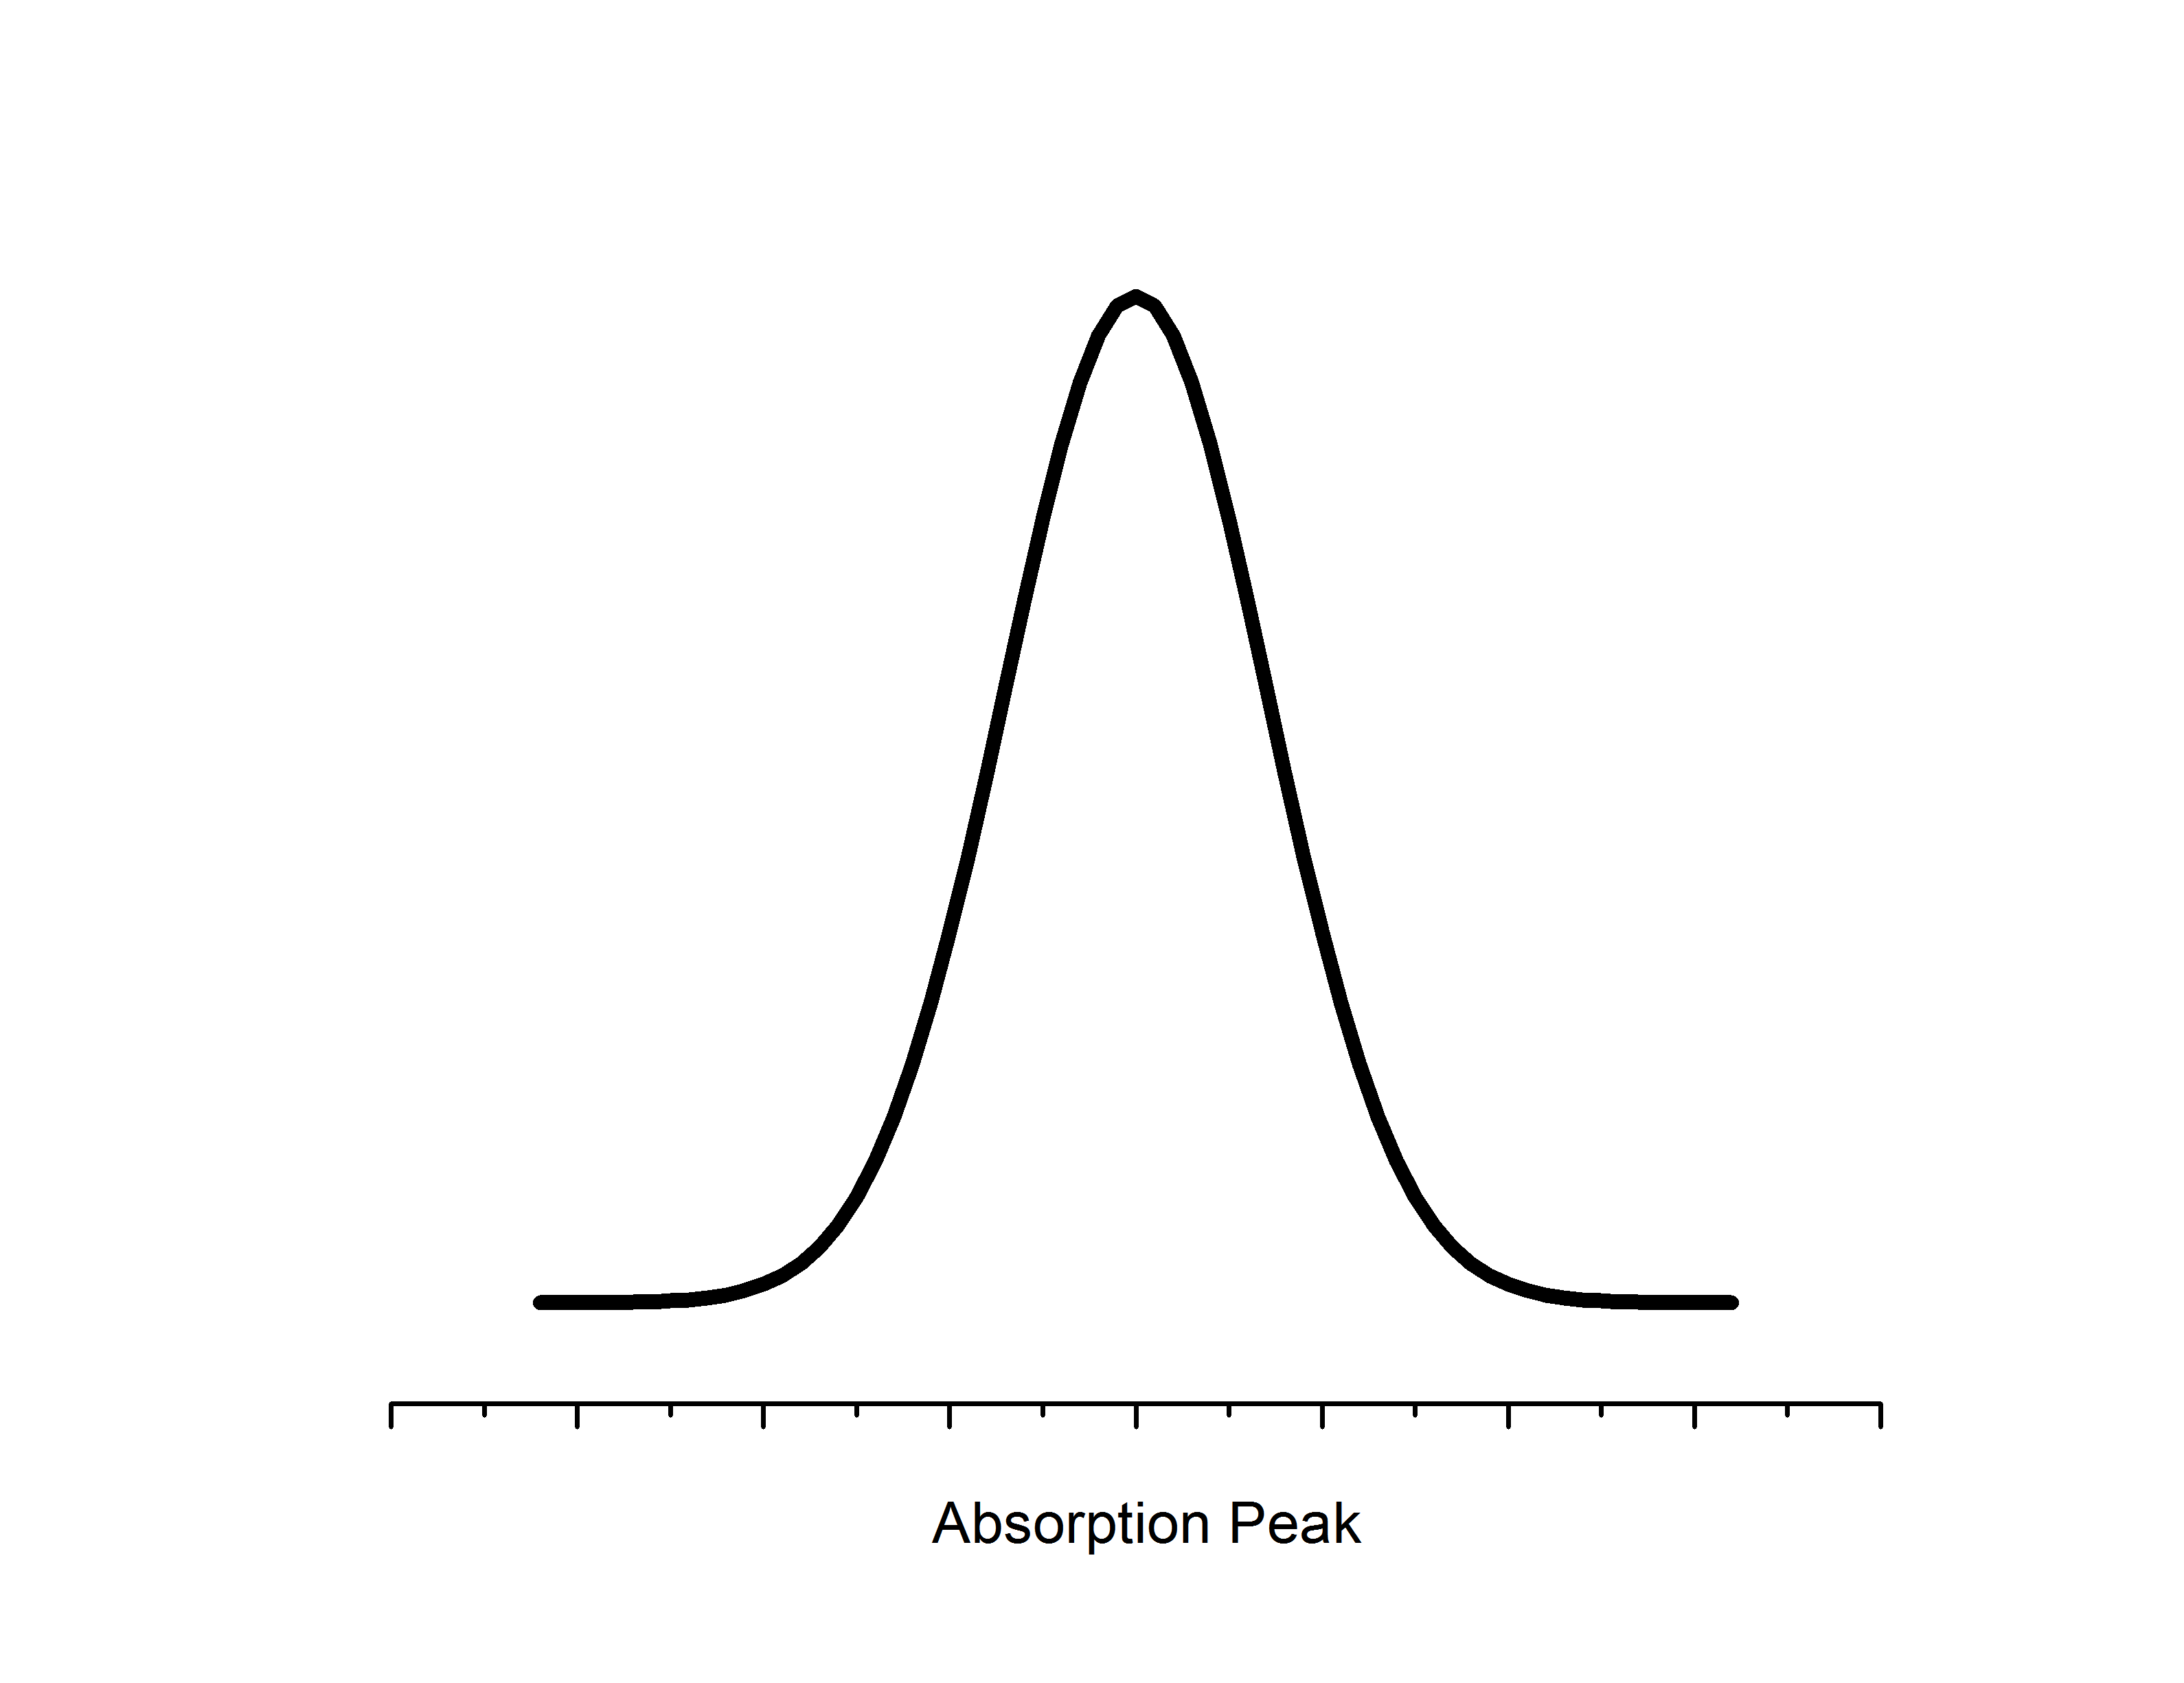
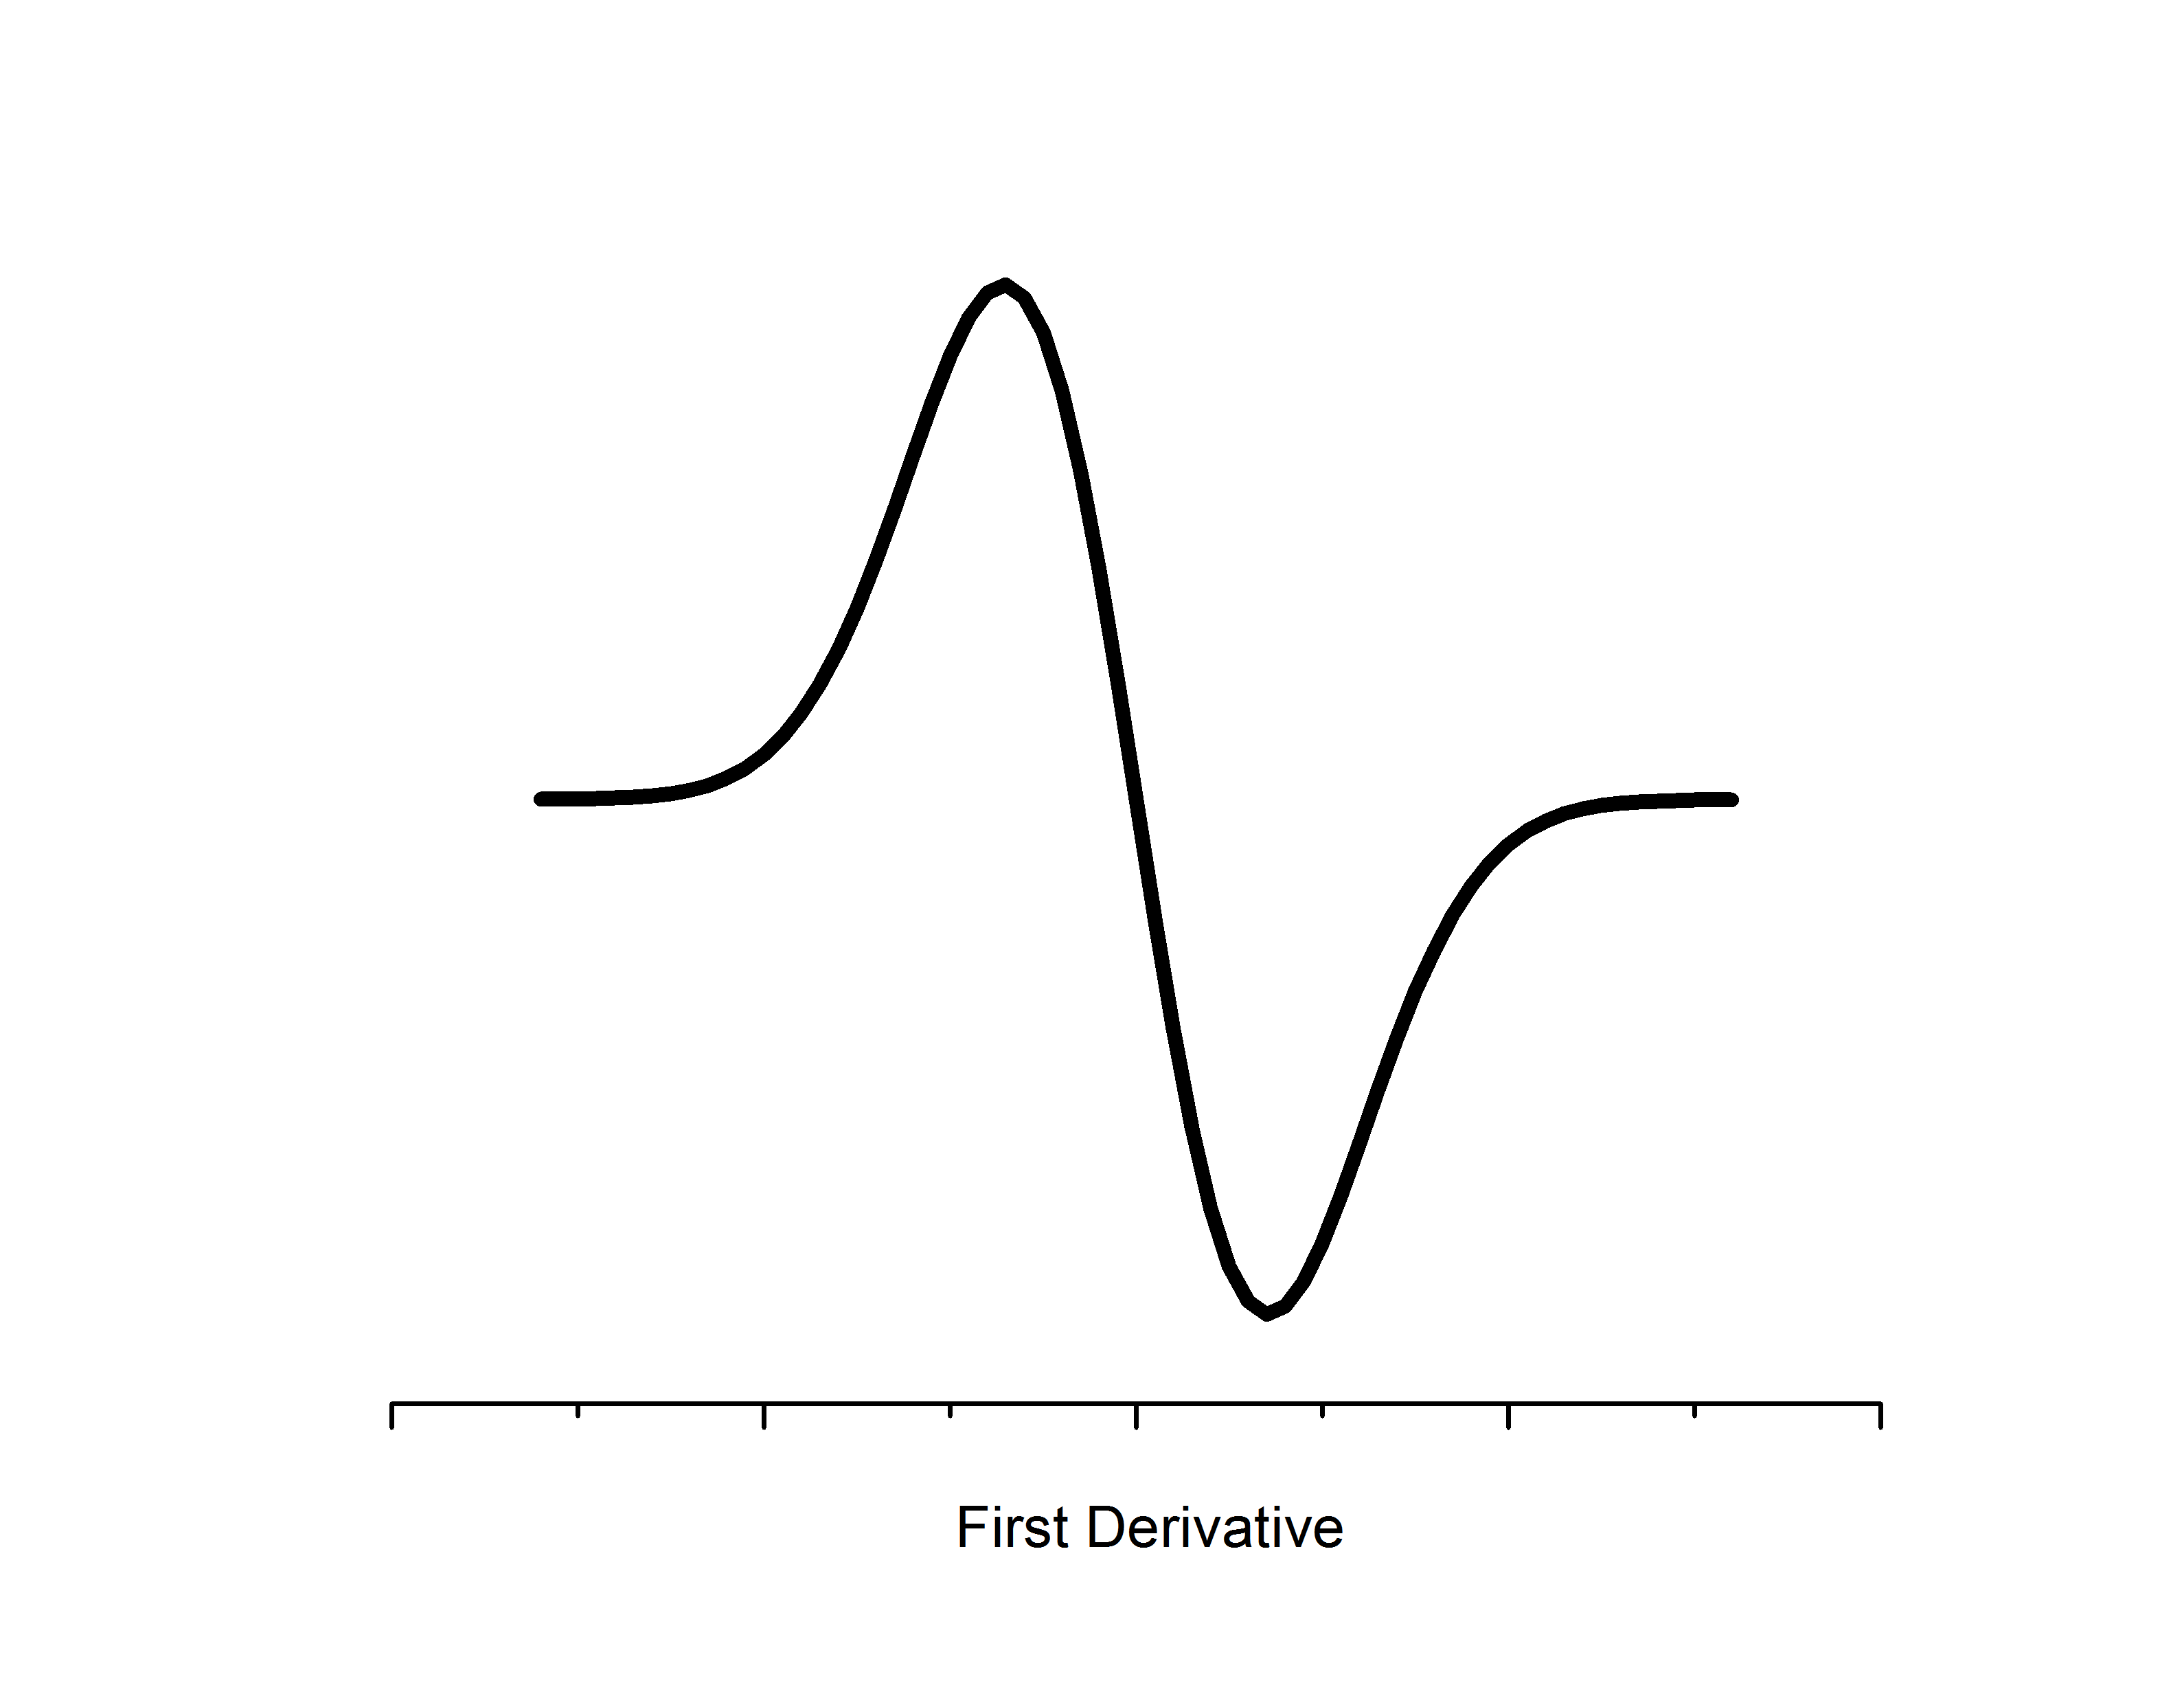
The intensity of absorption by the sample is directly proportional to the relative numbers of unpaired electrons in the sample. Double integration of the derivative spectrum of absorbance can be used to estimate concentrations - which is utilized for quantitative EPR studies, especially those that are characterizing kinetics.
Hyperfine Coupling
Fine structure in EPR arises from hyperfine coupling between the electron and nuclear spin magnetic moments. The most prominent interaction is from Fermi contact by unpaired electrons with s character and the nucleus. A nucleus of spin n/2 give (n+1) lines with equal intensity. Furthermore, an electron can couple to n nuclei giving n+1 lines - the intensities of which follow a binomial distribution. The distance between these lines are measured in the change in magnetic field (gauss or tesla) and is called the Hyperfine Splitting Constant (A).
The g factor of paramagnetic electrons are different from the free electron due to coupling of the orbital angular momentum and the spin (spin-orbit coupling). The strength of the coupling is dependent on direction (anisotropic). For low viscosity solutions the effects of anisotropy are averaged out. However, in crystal EPR the sample molecules are oriented in a fixed direction and the anisotropy cannot be ignored. Every paramagnetic molecule has a principal axis system that is a set of unique axes that each have their own g values (gx, gy, and gz) and hyperfine splitting constants.
Anisotropy causes the g factor to be a second-rank tensor. The principle axis system must be selected such that the g-tensor 3x3 matrix can be diagonalized to three components gxx, gyy, and gzz. For frozen powdered samples anisotropy can play a role depending on the system being studied.
| Type of Frozen Sample | g-value Relationship |
|---|---|
| Isotropic | gx = gy = gz |
| Axial | gx = gy \(\neq\) gz |
| Rhombic | gx \(\neq\) gy \(\neq\) gz |
Advantages and Disadvantages
EPR has many useful applications for paramagnetic samples. It very useful for studies of complex macromolecules - specifically in identifying unknown molecules within macromolecules (e.g. Fe-S clusters), and is also useful for quantification (e.g. spin relaxation). EPR is a very sensitive technique and is capable of providing useful data in volumes as low as 300μL and concentrations as low as 1 μM. Furthermore, EPR spectra can be readily taken in 15-20 minutes once the equipment is prepared.
Although EPR has high specificity - that specificity relies on unpaired electrons which might not be relevant to every system being studied. Most paramagnetic materials need temperatures as low as 20K for detection which can be an expensive constraint.
Applications in Biology
EPR is a very useful tool to study proteins with metal clusters, as proteins are usually in low concentration and volume. Just the ability of EPR to probe a metal site in an enzyme reveals information. For example, in [NiFe] hydrogenase there are many steps in the catalytic cycle where an iron atom is EPR silent and a nickel atom switches between EPR active and silent depending on the catalytic state. This, coupled with coordination information from the crystal structure, is strong evidence that the EPR silent iron must be low spin Fe(II) and the nickel cycles between Ni(I) and Ni(II) in the different catalytic states.
Also, it is very popular to spin label sites in a protein for exploration with EPR. Spin labeling usually takes advantage of the reactivity of protein thiol groups from cysteines. The most commonly used spin label is a nitroxyl radical bound to a larger heterocyclic ring. In principle this allows previously EPR silent regions to be explored. By using complex pulsed EPR techniques, such as double electron electron resonance, the distances between spin labels (or natural paramagnetic sites) can be determined - this is especially useful when crystallographic structures are unavailable.
References
- E. Zavoisky, J. Phys., 1945, 9(2), 211.
- Brisdon, A. Inorganic Spectroscopic Methods. Oxford University Press, 1998.
- Scott, R. Lukehart, C. Applications of Physical Methods to Inorganic and Bioinorganic Chemistry. Wiley-Interscience. 2007.
- Weil, J. Wertz, J. Bolton, J. Electron Paramagnetic Resonance: Elementary Theory and Practical Applications'. McGraw-Hill, John Wiley & Sons, New York, 1994.
Suggested Reading
- A. J. Hoff ed., ‘Advanced EPR: Applications in Biology and Biochemistry’, Elsevier, Amsterdam, 1989.
- A. Abragam and B. Bleaney, ‘Electron-Paramagnetic Resonance of Transition Ions’, Dover Publishing, New York, 1986.
- G. E. Pake, ‘Paramagnetic Resonance’, W. A. Benjamin, New York, 1962.
- S Eaton, G. Eaton, 'Electron Paramagnetic Resonance', Ewing's Analytical Instrumentation Handbook. CRC Press. 2004.
*Nuclei include neutrons which have magnetic moments because they are composed of subatomic particles with charge.