
The Uncertainty of Grades in Physics Courses is Surprisingly Large

( \newcommand{\kernel}{\mathrm{null}\,}\)
The statistical uncertainty in final grades in Physics courses is shown to be at least about 4% out of 100%, and is probably significantly higher than this.
Almost all teachers are required to submit final grades for their students. In this note we discuss the uncertainty in those grades with an emphasis on grades in physics courses. We will estimate that the statistical uncertainty in final grades is at least 4% out of 100%, and is probably significantly higher than this. The implications of this result on things like calculating Grade Point Averages are large.
For multiple-choice tests there is a large body of statistical work[1], which we will briefly review. The reliability r of a particular test can given by the Cronbach α coefficient [2]:
r = \alpha = \frac{K}{ K -1} \left[1-\frac{ \sum_{i=1}^Kp_i(1-p_i) }{\sigma^2}\right] \tag{1}
where K is the number of questions on the test, pi is the fraction of correct answers for question i, and σ is the standard deviation of the scores on the test. The values of r are between 0 and 1. Professionally developed high-stakes standardized tests achieve reliabilities of at least 0.9, and by convention values of r less than 0.5 indicate a poorly designed test. It turns out that the reliability of a test increases as the number of questions on it increases [3,4,5].
From the reliability, the standard error or measurement s can be calculated [6]. This is the statistical uncertainty in each individual student’s grade on the test, and is given by:
s = \sigma \sqrt{1-r} \tag{2}
The interpretation of s is similar to the standard deviation of experimental measurements: 1 s corresponds to a 68% confidence interval, 2 s to a 95% confidence interval, etc.
For physics tests the issue of using multiple-choice questions as opposed to long-answer questions, which are marked in detail with part grades awarded, is religious, and we will try to avoid those arguments here. In our large (900-student) 1styear university physics course primarily for life-science students, we typically have about 75% of the grades on each test and exam determined by multiple-choice questions, and about 25% determined 2 by one or more long-answer questions. Since our typical multiple-choice question takes the student about 5 minutes to do, we can have between eight and sixteen such questions on each test and exam. This is different from tests in subjects that are fact-based, such as introductory psychology, where colleagues in those Departments report that each question on tests and exams in their introductory course takes the students about 1 minute to do, so in the same time period up to 50 questions can be asked.
Over the past couple of years the best reliability we ever achieved on the multiple-choice section of our tests and final exam was r = 0.70 with a corresponding standard error of measurement sMC = 11%. Thus we can only distinguish between grades on this part of the test to within an uncertainty of over a full letter grade. The comparatively poor reliability and corresponding high error of measurement is undoubtedly in part because of our lack of skill in setting a good test, but it also a reflection of the small number of questions we can ask. Courses in, say, introductory psychology, with more multiple choice questions, often achieve higher reliabilities and smaller errors of measurement than we have managed to achieve. Below we will assume this best value of sMC = 11% for all tests and exams in a model course. Therefore, our calculation of the uncertainty in the final grade is definitely a lower bound.
For the long-answer section of our tests and exam, we do not know of any way to estimate a standard error of measurement sLA. For our typical test with 75% multiple choice and 25% long-answer grades, the test grade is:
test~ grade = (multiple-choice ± s_{MC} )\times0.75 + (long-answer ± s_{LA} )\times 0.25 \tag{3}
Since the values of s are uncertainties of precision, they should be combined in quadrature, i.e. the square root of the sum of the squares. Thus the uncertainty in the test grade sT is:
s_T = \sqrt{(s_{MC} \times 0.75)^2 + ( s_{LA} \times 0.25)^2 }\tag{4}
If we assume that the multiple-choice and long-answer sections have equal standard errors of measurement, sMC = sLA = 11%, i.e. that they both are equally effective in assessing students, then from Eqn. 4 sT = 8.70 ! 9%. We will also assume that the standard error of measurement on the final exam, sFinal, also is 9%.
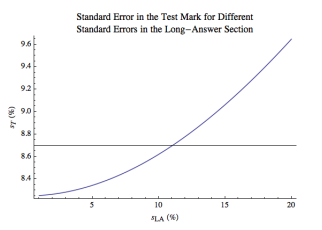
The uncertainty in the test grade given by Eqn. 4 is not highly dependent on the uncertainty in the long-answer section. This is an artifact of the use of quadrature to combine uncertainties in Eqn. 4. Figure 1 shows the value of sT for values of sLA from 1% to 20%. The value of sT varies from 8.25 to 9.65%. In the figure, the horizontal line is the value of Eqn. 4 for the assumed values of sMC = sLA = 11%.
We will also assume that for the parts of the final grade in the course that are not from tests and the exam, such as problem sets or laboratories, there is no error of measurement in these grades, i.e. that they are perfect in assessing students; this assumption is certainly not true.
Often in our course, we have two term tests and a final exam. Each test counts for 15% of the grade in the course and the final exam counts for 40%. Therefore, using our extremely optimistic assumptions the final grade in the course is:
final~ grade = (Test1± 9)\times 0.15 + (Test2 ± 9)\times0.15 + (Final ± 9)\times 0.4 + (term work ± 0)\times 0.30 \tag{5}
The standard error of measurement for the final grade, sFG, is:
s_{FG} = ( s_{Test1} \times 0.15)^2 + ( s_{Test2} \times 0.15)^2 + ( s_{Final} \times 0.4)^2 + (0 \times 0.3) 2 \tag{6}
Since we have made many assumptions that make these errors lower bounds, the actual uncertainty in the final grade is certainly larger than the value obtained by just propagating the errors in Eqn. 6. Therefore the result of the calculation gives us:
\Delta(final~ grade) > 4\% \tag{7}
Thus final grades of, say, 76% and 77% are the essentially identical within errors.
The dominant contribution to the result Eqn. 7 is from the uncertainty in the final exam. If we model a course with one term test counting for 30% of the grade in the course, with 4 the final exam still counting for 40%, the uncertainty in the grade rises to !(final mark) > 4.5% .
We made many assumptions to get to Eqn. 7. So the calculation is a type of Fermi Question: different sets of reasonable assumptions will lead to a very similar result. Therefore we believe that the uncertainties in final grades in our courses are probably comparable to those given to students in most physics courses at most schools.
At the University of Toronto, a 76 corresponds to a letter grade of B and a 77 corresponds to a letter grade of B-plus. For calculating a Grade Point Average (GPA) the university makes a distinction between B and B-plus with the former having a value of 3.0 and the latter 3.3. So the effect on the student’s GPA of these two essentially identical final grades is large. This same ill-advised procedure is common in one form or another at many schools.
In Toronto we have had considerable discussion about what to do about this, but without a satisfactory resolution. For example, we could convert grades of 76 to 77. But then what about 75? And if we change 75 to 77, then what about 74? We have also considered rounding all grades to the nearest 5, but that would mean that a grade of 78 goes to 80, an A, while 77 goes to 75, a B. We also discussed rounding up to the nearest grade that is evenly divisible by 5, but this makes a huge distinction between a 75, which stays the same, and a 76, which goes to an 80. Perhaps the only resolution is to drop the GPA calculation entirely.
Failing that institutional change, when we are confronted with the list of student names and final course grades that we are to turn in at the end of the course, we need to at least be sensitive to the large uncertainty in the numbers. 5
REFERENCES
1. See, for example, L.M. Harvill, “An NCME Instructional Module on Standard Error of Measurement,” ITEMS: Instructional Topics in Educational Measurement (1991), ncme.org/linkservid/6606715E-...88/showMeta/0/ (retrieved June 4, 2013), or AERA, APA and NCMD, Standards for educational and psychological testing. American Psychological Association, 1985.
2. L. Cronbach, “Coefficient alpha and the internal structure of tests,” Psychomerika 33, 297 (1951). There are other statistics that measure the reliability, such as the KuderRichardson Formula 20, but for our purposes they are all equivalent.
3. J. Nunnaly and L. Bernstein, Psychometric Theory, McGraw-Hill, 1994.
4. R. Cohen and M. Swerdlik, Psychological Testing and Assessment, McGraw-Hill, 2010.
5. M. Tavakol and R. Dennick, “Making sense of Cronbach’s alpha,” International Journal of Medical Education 2, 53 (2011).
6. W.G. Mollenkopf, “Variation of the standard error of measurement,” Psychometrika 14, 189(1949). Note: this paper appeared in Physics in Canada 70(2), 75 (2014).