
A record-setting example of the Lyman dropout technique


- Last updated
- Dec 30, 2020
- Save as PDF

( \newcommand{\kernel}{\mathrm{null}\,}\)
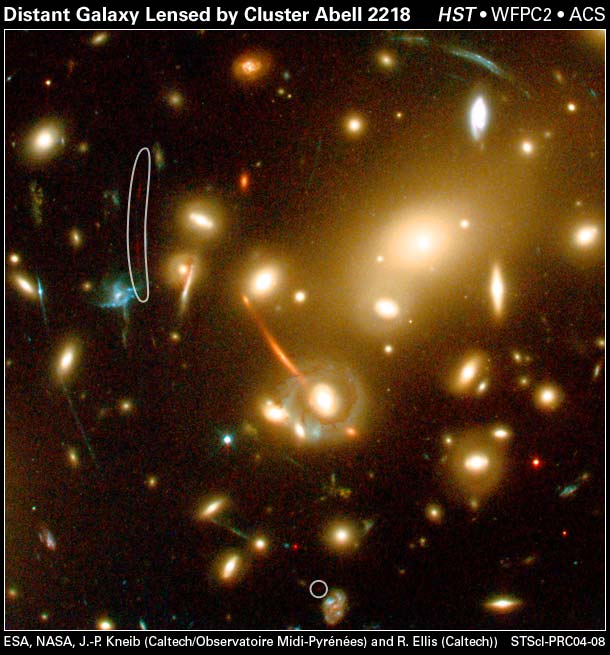
You can see a number of large, curved arcs in this system. Each one is a distorted view of a galaxy which lies far behind the cluster. As the light from the distant galaxies passes through the cluster on its way to us, it is bent by the gravitational field of the cluster. The result is a stretched-out version of the background galaxy.
If you look closely, you can see that some of the arcs look very red in this color picture.
The color picture is a composite of several images taken through wide-band filters. Let's look at the individual images, and zoom in on the location of these red arcs:
Just what are the wavelengths of the filters used to take these pictures?
Can you estimate the redshift the galaxy must have in order to produce lots of flux in the reddest filters?
In order to confirm the redshift, one needs to have a spectrum. The arcs are so faint that one is hard to acquire, even with an 8-m telescope. Here's a spectrum in the near-IR:
Hmmmmmm..... hard to see any distinctive features there. Let's look at that same spectrum more closely ....
The authors suggest that there is a "break" in the spectrum at around 9800 Angstroms. Do you agree? What redshift would that indicate, if it is due to the Lyman limit?
For more information
- STScI press release
- A Probable z~7 Galaxy Strongly Lensed by the Rich Cluster Abell 2218: Exploring the Dark Ages, by Kneib, Ellis, Santos and Ellis, soon to appear in ApJ. This technical paper describes the discovery of the galaxy.