
Effective Teams for Collaborative Learning in an Introductory University Physics Course

( \newcommand{\kernel}{\mathrm{null}\,}\)
INTRODUCTION
Physics Education Research (PER) has led to an increased emphasis on collaborative learning in reformed-pedagogy physics courses around the world. Some of the best known examples are Peer Instruction, McDermott’s Tutorials in Introductory Physics2 and Laws’ Studio Physics. 3 Therefore, questions about how to structure teams of students for collaborative learning to achieve the best possible outcomes are increasingly important.
Psychologists investigate important questions about the types of collaborative learning that are most effective,4 and their research has a number of different approaches to these questions.5 Within the PER community, there is a long tradition of another approach to these questions: videotaping, transcribing, and analyzing student interactions.6
In this study we instead ask some comparatively simple questions about teams of students engaged in collaborative learning. First, should the teams of students be sorted by student ability, or instead should the teams contain a mix of strong, medium, and weak students?
Second, is a team of 3 students better than a team of 4 students? Finally, previous studies suggest that a team of only one female student with the rest males should be avoided, because the male students will dominate the interactions in the team.7,8 Is this true for our students?
Regarding heterogeneous and homogeneous groups, in a study and survey of previous work Jensen and Lawson wrote in 2011, “In sum, the few college-level studies that have been done reveal no clear consensus regarding the better group composition.”9 So far as we know, this situation has not changed since 2011.
The prediction that learning in teams can be more effective than learning as isolated individuals was first best articulated by Lev Vygotsky.10 He introduced the concept of the zone of proximal development, which describes what a student can do with help, as compared to what he or she can do without help. In the context of collaborative learning and peer instruction, each student’s teammates form the scaffolding needed to keep the student within their most effective zone of proximal development.11 If an instructor designs each team to have a maximal spread of talents, this should improve the availability of appropriate scaffolding available to the weaker students. However, if the ability levels of two collaborators are too far-separated, the efficacy of the collaboration can actually decrease. This is often pointed to as why peer instruction is more effective; two students of differing ability level are still closer to one another than a student and an instructor. This argues that perhaps an entirely opposite strategy for prescribing team composition is best, in which students are sorted into homogeneous teams by ability: in this way, the top students would interact with each other at a higher level without making any weaker students feel excluded, while the weaker students would also be interacting with each other at an appropriate level.
The Force Concept Inventory (FCI) is an important tool in PER. The FCI was introduced by Hestenes, Wells and Swack hammer in 1992,12 and was updated in 1995.13 A common methodology is to administer the instrument at the beginning of a course, the “PreCourse”, and again at the end, the “Post-Course” and to examine the gain.
In PER, gains on diagnostic instruments such as the FCI have long been used to measure the effectiveness of instruction. For example, when Mazur converted from traditional lectures to Peer Instruction at Harvard in 1991, Peer Instruction was shown to be a better way of teaching by showing that the normalized gains on the FCI increased from 0.25 to 0.49.14 Fagen, Crouch, and Mazur also used normalized gains on the FCI to demonstrate the increased effectiveness of Peer Instruction compared to traditional lectures by over 700 instructors at a broad array of institution types across the United States and around the world.15 Hake’s seminal paper of 1998 also used gains on the FCI for over six thousand students to demonstrate that interactive engagement was more effective than traditional instruction. 16 Recently Freeman et al. did a meta-analysis of 225 studies comparing lectures to active engagement in STEM courses that confirmed that active engagement was more effective than traditional lectures.17 The Freeman meta-analysis looked at test scores and dropout rates, showing that measuring effective pedagogy using a different metric than FCI gains comes to the same conclusion. 3 Using gains on the FCI to measure effective teaching is still common in PER, although the questions that are being asked are somewhat more sophisticated. For example, in 2011 Hoellwarth and Moelter used gains on the FCI and the related Force-Motion Concept Evaluation instrument18 to show that for a particular implementation of Studio Physics there was no correlation with any instructor characteristics.19 In 2015 Coletta used FCI gains as one tool to investigate scientific reasoning ability of students and also gender correlations with performance in introductory physics.20 Also in 2015, we used FCI gains to compare the normal 12-week term of the course that is studied here to the compressed 6-week version given in the summer. 21
Although our study is of students in a freshman university physics course for life science majors, we expect that our results are relevant for many courses that do collaborative learning, both in other physics courses, in courses other than physics, and probably at the secondary as well as post-secondary level.
II. THE COURSE
We examined team effectiveness in our 1000-student freshman Physics course intended primarily for students in the life sciences (PHY131). PHY131 is the first of a two semester sequence, is calculus based, and the textbook is Knight.22 Clickers, Peer Instruction, and Interactive Lecture Demonstrations23 are used extensively in the classes. The session that is studied here was held in the fall of 2014.
In addition to the classes, traditional tutorials and laboratories have been combined into a single active learning environment, which we call Practicals. 24 In the Practicals students work in small teams on conceptually based activities using a guided discovery model of instruction, and whenever possible the activities use a physical apparatus or a simulation. Most of the activities are similar to those of McDermott and Laws, described in Refs. 2 and 3 respectively, although we also spend some time on uncertainty analysis and on experimental technique such as is found in traditional laboratories. The typical team has 4 students. The students attend a two-hour Practical every week, and there are 10 Practicals in the term. It is the effectiveness of the teams in the Practicals that is studied here.
A third major component of the course is a weekly homework assignment. We use MasteringPhysics25 and the typical weekly assignment takes the students about one hour to complete. Although we use some of the tutorials provided by the software to help student’s conceptual understanding, the principle focus of most homework assignments is traditional problem solving, both algebraic and numeric. We expect most students do these assignments as individuals, although we do not discourage the students from working on them together in a study team.
We gave the Force Concept Inventory (FCI) to students in PHY131. The students were given one-half a point, 0.5%, towards their final grade in the course for answering all questions on the Pre-Course FCI, regardless of what they answered, and given another one-half point for answering all questions on the Post-Course FCI also regardless of what they answered. Below all FCI scores are in percent. The student’s score on the PreCourse FCI was used to define whether he/she was strong, medium or weak.
Interactive engagement is the heart of the learning in our Practicals, and in this study, as discussed below, we have separated the variable of the type of team by constructing them in different ways for different groups based on the students’ strength.
We used gains on the FCI from the Pre-Course to the Post-Course as one measure of the effectiveness of instruction that arises from student interactions in the Practicals. We also compared final examination grades for different types of teams. Although the FCI and the final examination both measure student understanding of related content of classical mechanics, they do not measure exactly the same thing. First, the FCI is purely conceptual, although Huffman and Heller did a factor analysis of the FCI and concluded that it “may be measuring small bits and pieces of students’ knowledge rather than a central force concept, and may also be measuring students’ familiarity with the context rather than understanding of a concept.”26 Our course and therefore final examination was about classical mechanics through rotational motion and oscillations, but not waves. Table I shows the type of questions that were asked on the final examination. As can be seen, 64% of the exam tests traditional problem solving, which is not examined by the FCI. We also looked at the end of term anonymous student evaluations for different ways of assigning students to teams.
Table I. Types of questions on the final examination Type of Question Percentage Numeric problems 61 Algebraic problems 3 Conceptual questions 27 Interpreting graphs 3 Uncertainty 6
III. METHODS
We only studied Practical teams whose membership did not change from early in the term to the end of the term, which reduced the total number of students in our sample to 690. Each Practical group contains up to 9 teams, and although most teams have four students, due to logistic constraints 15% of the teams had three students and four teams out of 178 that we studied had five students. We do not allow teams of fewer than 3 or greater than 5 students. Each group of about 36 students has two Teaching Assistants present at all times.
This study caused us to make only two changes in the structure of the course for this year only. In past years the students were initially assigned to teams in the Practicals randomly, and half way through the term the teams were scrambled; the first meeting of the new teams began with an activity on teamwork.27 This term we did not scramble the teams and, not entirely because of this study, we did not use the teamwork activity. Therefore, the composition of the teams typically only changed because dropouts required some re-distribution of students within a group, or, rarely, because a team was felt by the TAs to be dysfunctional or even toxic.
The second change in the structure of the course was that we assigned students to teams based on their Pre-Course FCI score. We had 30 groups, each typically consisting of about 36 students divided into 9 teams of 4 students. We used two methods for assigning students to teams, which we call “spread” and “sorted.” For the “spread” method, which we used for about half of the groups, we assigned team numbers 1, 2, 3, 4, 5, 6, 7, 8 and 9 to the top nine students based on FCI score, respectively. Then the next nine students were also assigned to teams 1 through 9, and so on. For the “sorted” method, which we used for the other half of the groups, we assigned the students with the top four FCI scores to team number 1, then the next four students to team number 2, and so on; all four of the students with the lowest FCI scores were assigned to team number 9. In total, 16 groups were “spread” and 14 groups were “sorted”. In order to avoid biases by our TA Instructors, we did not inform them that we had constructed the teams in this way.
A. Classifying Students and Teams
We classified students as “strong,” “medium,” and “weak” by their score on the PreCourse FCI. A strong student is one whose score was in the upper third of the class, a medium student in the middle third, and a weak student in the bottom third.
We defined a “weak” team as one for which all students were weak, a “medium” team as one with all medium students, and a “strong” team as one where all student Pre-Course scores were strong. A “mixed” team had at least one strong student, one medium student and one weak student. Note that some teams, such as one with one medium student and three weak ones, are not included in any of these types.
In addition to the standard 30 questions on the FCI, on the Pre-Course FCI we asked some further non-graded questions about the student’s background, motivation for taking the course, and their gender. The gender question, and the number and percentage of students in each category, was:
What is your gender?
A. male (405 students = 40%)
B. female (603 students = 59%)
C. neither of these are appropriate for me (9 students = 1%)
In our gender analysis, we ignored the nine students who chose C in the above question. Not all students answered this question, and therefore received no credit for taking the Pre-Course FCI.
B. The FCI
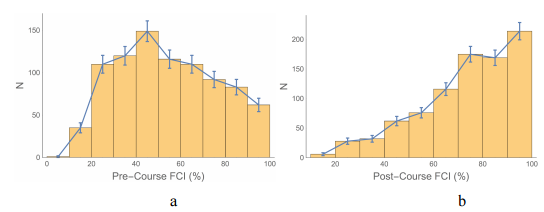
1045 students took the Pre-Course FCI, which was almost all students in the course. 910 students took the Post-Course FCI, again almost all students still enrolled in the course. The difference in these numbers is almost entirely because of students who dropped the course. In our analysis we only used FCI scores for “matched” students who took both the Pre-Course and the Post-Course FCI. This was 878 students. The 32 students who took the Post-Course FCI but not the Pre-Course FCI were late enrollees or missed the Pre-Course for some other reason.
Figure 1(a) shows the Pre-Course scores and Figure 1(b) shows the Post-Course scores for the matched students. The displayed uncertainties are the square root of the number of students in each bin of the histogram. Neither of these distributions are Gaussian, especially the Post-Course one, so the mean is not an appropriate way of reporting the results. We will instead use the median of the scores. The uncertainty in the median is taken to be ±1.58 × IQR / √N where IQR is the interquartile range and N is the number of students.28 This uncertainty is taken to indicate very roughly a 95% confidence interval, i.e. the equivalent of 2 ×σm for normal distributions where σm=σ/√N σ m = σ / N is the “standard error of the mean.”29
We used the gain on the FCI as one measure the effectiveness of different types of teams. The standard way of measuring student gains is by Hake in Reference 16. It is defined as the gain normalized by the maximum possible gain:
G=PostCourse%−PreCourse%100−PreCourse%
Clearly G cannot be calculated for Pre-Course scores = 100. This was 8 students in our course.
One hopes that the students’ performance on the FCI is higher at the end of a course than at the beginning. The standard way of measuring the gain in FCI scores for a class or subset of students in a class is called the average normalized gain, to which we will give the symbol mean, and was also defined by Hake in Reference 16:
<g>mean=<PostCourse%>−<PreCourse%>100−<PreCourse%>
where the angle brackets indicate means. However, as discussed, since the distribution of FCI scores is not Gaussian, the mean is not the most appropriate way of characterizing FCI results. We will instead report < g >median , which is also defined by Eqn. 2 except that the angle brackets on the right hand side indicate the medians. The uncertainties in the median normalized gains reported below are the propagated uncertainties in the Pre-Course and Post-Course FCI scores. Since both of these are uncertainties of precision, they should be combined in quadrature, i.e. the square root of the sum of the squares of the uncertainties in the Pre-Course and Post-Course scores. Therefore from Eqn. 2, for the median normalized gain:
Δ(<g>median)
=√(∂(<g>)∂(<PreCourse%>)Δ(<PreCourse%>))2+(∂(<g>)∂(<PostCourse%>)Δ(<PostCourse%>))2
=√(<PostCourse%>−100(<PreCourse%>−100)2Δ(<PreCourse%>))2+(Δ(<PostCourse%>)100−<PreCourse%>)2
where Δ(< PreCourse% > and Δ(< PostCourse% > are the uncertainties in the medians of the Pre-Course and Post-Course FCI scores.
C. The Final Examination
968 students completed the final examination in the course. In our analysis of examination grades, we only looked at the 899 students who also completed the PreCourse FCI. The mean grade for these students was (47.63± 0.68)% where the uncertainty is the “standard error of the mean.” Although this mean was lower than we intended, the fact that it is close to 50% and also that the grades had a wide distribution ( σ = 20% ) means that the examination is close to perfect for discriminating between students.30 We used final examination grades as another measure of the effectiveness of different types of teams.
If the mean grade on the final examination were usually 47%, as it was 2014, this could have a dramatic effect on student attitudes towards the course and that in turn could negatively impact the interpersonal dynamics of collaborative learning in the course. At the University of Toronto, grades for 60 – 69 are classified as “C” and grades of 70 – 79 are “B”. Typically the mean grade on the final examination in this course is between 65 8 and 70, which is consistent with other courses at the university. So 2014 was atypical, and could not retroactively impact the attitudes of students towards the course studied here. Figure 2 shows a boxplot of the final examination grades for different student strengths as determined by their Pre-Course FCI scores.
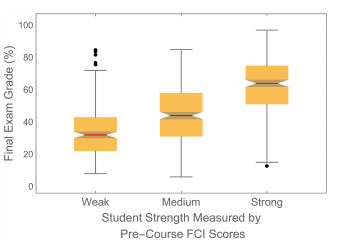
The “waist” on the boxplot is the median, the “shoulder” is the upper quartile, and the “hip” is the lower quartile. The vertical lines extend to the largest/smallest value less/greater than a heuristically defined outlier cutoff.31 The dots represent data that are outside the cutoffs and are considered to be outliers. The “notch” around the median value represents the statistical uncertainty in the value of the median; notched boxplots were first proposed in Reference 28.
Because of the large overlap of the ranges of exam grades seen in the boxplot, the Pearson correlation coefficient of Pre-Course FCI scores and exam grades is only 0.62. Nonetheless the boxplot makes it clear that the exam grades are significantly correlated with the FCI scores. This gave us confidence that using the Pre-Course FCI scores to classify students by ability is reasonable.
Because of the large overlap in the range of exam grades, using the Pre-Course FCI as a placement tool for students is not appropriate. A similar conclusion, with more sophisticated analysis, was reached by Henderson in 2002.32
IV. RESULTS
In this section we will first discuss the normalized gains on the FCI, then discuss final examination grades, and finally present some data about the “sorted” and “spread” groups.
As mentioned, 690 students were in teams whose membership did not change throughout the term. Not all of these students were in various categories examined below. For example, students in a team with 2 strong and 2 medium members are not in either a strong, medium, weak, or mixed team. Similarly those few students in a team with 5 members were not part of the sample comparing teams with 3 members to those with 4 members. Table IV below includes the sample sizes for students who completed the final examination. Almost but not quite all students who completed the exam also completed both the Pre-Course and Post-Course FCI, and the sample sizes for the FCI data are all within ±5 students of the values in Table IV.
A. Gains on the FCI
As discussed, we defined a “strong” student as one whose Pre-Course FCI score was in the upper third of the class, a “medium” student as one whose score was in the middle third, and a “weak” student a one whose score was in the bottom third. There were 273 strong students and for them < g >median= 0.500 ± 0.086 ; there were 339 medium students with < g >median= 0.467 ± 0.036 ; there were 266 weak students with < g >median= 0.409 ± 0.036 . These values are equal within uncertainties.
Table II summarizes the median normalized gain for strong, medium, mixed, and weak teams. The different values of <g>median and the median of G for different types of teams are also all are roughly equal within uncertainties. Recall that the stated uncertainties correspond to a 95% confidence interval, i.e. they are equivalent to twice the uncertainty given by the standard deviation for data that are normally distributed.
Also shown in Table II are the results for all students. For <g>median the value is for the 878 matched students, while for the median of G the value is for the 870 matched students who did not score 100% on the Pre-Course FCI.
Table II. Median normalized gains for different team types and for all students
| Team Type | Number of Teams | Number of Students | <g>median | Median of G |
|---|---|---|---|---|
| Weak | 12 | 44 | 0.432 ± 0.088 | 0.438 ± 0.084 |
| Medium | 22 78 | 78 | 0.548 ± 0.091 | 0.515 ± 0.081 |
| Mixed | 56 | 210 | 0.467 ± 0.072 0.439 ± 0.044 | 0.439 ± 0.044 |
| Strong | 22 | 80 | 0.50 ± 0.13 | 0.455 ± 0.082 |
| All students | 178 | 878 / 870 | 0.533± 0.034 | 0.452 ± 0.023 |
Examining the individual normalized gains G tells a similar story. Figure 3 is a boxplot for the different team types. The vertical scale of the boxplot has been chosen so that the 10 values of G less than -0.95 are not displayed: these student outliers most likely put less effort into the Post-Course FCI due to end-of-semester fatigue, or a cynical awareness 10 that the participation points would be awarded regardless of their answers. These students were all in mixed or strong teams: there were no outliers for the weak or medium teams. The boxplot shows that there are no significant differences in the values and distributions of G for the different types of teams, except perhaps for the outliers.
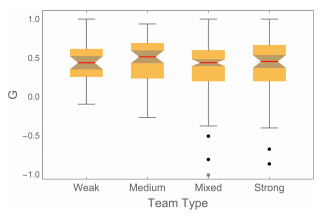
Table III shows the median normalized gains for strong, medium, and weak students in the 56 mixed teams.
Table III. Median normalized gains for different student strengths in mixed teams.
| Student Strength | Number of Students | <g>median | Median of G |
|---|---|---|---|
| Weak | 72 | 0.41± 0.06 | 0.40 ± 0.07 |
| Medium | 74 | 0.47 ± 0.05 | 0.49 ± 0.05 |
| Strong | 64 | 0.50 ± 0.16 0.37 ± 0.13 | 0.37 ± 0.13 |
Figure 4 is the boxplot of the values of G. The vertical scale is chosen so that two strong students whose G values were -3.0 and -3.6, and are therefore outliers, are not shown.
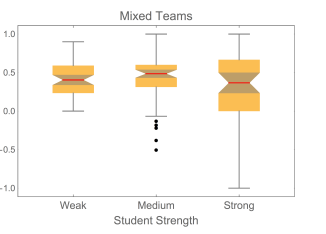
Note that the students in Table II and Figure 3, except for the mixed teams, are completely different from the students in Table III and Figure 4. For example, all strong students in our sample were either in a strong team or a mixed team.
Although the gains in Table III are the same within uncertainties, the somewhat low value for strong students is due to the fact that, as can be seen in Figure 4, some strong students seem to have put less effort into the Post-Course FCI: we will discuss this a bit more below. The comparatively large uncertainty the value is largely due to the large interquartile range.
We examined FCI gains for teams with 3 students and teams with 4 students. The values of median were <g>median 0.57 ± 0.14 and 0.50 ± 0.05 respectively, which are the same within uncertainties. The boxplot, which is not shown, also shows no significant differences in the distribution of values of G for the two groups.
For the 21 teams with one female student and the rest males, the median normalized gain for the female students was 0.35 ± 0.28 . The large uncertainty in this value is due to the small number of female students in the sample, but the gains here are the same within uncertainties as all of the other categories we examined. Although it might be interesting to look at gender correlations with the type of team the female student was in, we lack the statistics for such a study to be possible.
B. Final Examination Grades
Above we presented the overall mean final examination grade for the course: (47.63± 0.68)% . The 211 students in mixed teams had a mean exam grade of (46.8 ±1.4)%. Table IV summarizes the final examination grades for some other categories of students and teams.
Rows 1 and 2 of the table includes all strong students in our sample. The mean on the final examination for strong students in strong teams minus the mean for strong students in mixed teams is (61.6 ±1.8)− (64.2 ± 2.1) = (−2.6 ± 2.8) which is zero within uncertainties: this is the value shown in the final column of the table. The later rows are similarly constructed. In all cases, the differences are zero within uncertainties.
As already discussed, there are some insignificant differences in the number of students N for various categories compared to the numbers given in the previous sub-section. These are due to the fact that in the previous sub-section the data are for students who took both the Pre-Course and the Post-Course FCI, while the final examination grades are for students who took the Pre-Course FCI and completed the final examination, but not necessarily the Post-Course FCI. 12
Table IV. Final Examination Grades for Students in Different Types of Teams
| Type | N | Mean Final Examination Grade (%) | Difference |
|---|---|---|---|
| Strong students in strong teams | 84 | 61.6 ±1.8 | −2.6 ± 2.8 |
| Strong students in mixed teams | 66 | 64.2 ± 2.1 | −2.6 ± 2.8 |
| Medium students in medium teams | 79 | 43.3±1.9 | 0.0 ± 2.7 |
| Medium students in mixed teams | 76 | 43.3±1.9 | 0.0 ± 2.7 |
| Weak students in weak teams | 44 | 36.2 ± 2.6 | 2.3± 3.1 |
| Weak students in mixed teams | 69 | 33.9 ±1.6 | 2.3± 3.1 |
| Students in teams of 4 | 556 | 48.02 ± 0.84 | −0.9 ± 2.5 |
| Students in teams of 3 | 75 | 48.9 ± 2.4 | −0.9 ± 2.5 |
| Females in teams with one female | 21 | 45.5 ± 4.3 | 0.4 ± 4.4 |
| Females in teams with >1 female | 328 | 45.1±1.1 | 0.4 ± 4.4 |
C. Sorted and Spread Groups
As discussed, the initial team assignments were done two ways: in one-half the groups we assigned students so that all members of each team had roughly the same Pre-Course FCI scores, the “sorted” groups, and in the other half we distributed the students so that each team had a mixture of students with different Pre-Course FCI scores, the “spread” groups. The values of <g>median are 0.536 ± 0.062 for the sorted groups and 0.467 ± 0.057 for the spread groups, which are the same within uncertainties.
At the end of the semester 912 students filled out an anonymous paper-based evaluation during the Practicals. We do not know which type of team the students who participated in the evaluation were in, but we do know whether they were in a sorted or spread group.
Several questions on the evaluation asked about the TAs, but the first five questions asked specifically about student evaluations of the Practicals themselves; these questions are shown in the Appendix. Note that for all five questions, a response of 5 is in general the most favorable. Figure 5 shows the distribution of the means of the five questions for the two types of groups. The displayed uncertainties are based on taking the uncertainty in the number of students in each bin to be equal to the square root of that number. For the 427 students in sorted groups who participated in the evaluations, the mean of the five questions is 3.779 ± 0.031, and for the 485 students in spread groups it is 3.609 ± 0.031; since from Fig 5 the distributions are roughly normal, we have taken the uncertainty in the means to be the “standard error of the mean.”
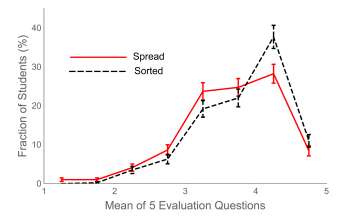
For data like the means of the 5 Practical evaluation questions for the two types of groups, Student’s T-Test is well known for testing whether or not the two distributions are the different. 33 It calculates the probability that the two distributions are statistically the same, the p-value, which is sometimes referred to just as p. By convention, if the pvalue is < 0.05 then the two distributions are considered to be different. For our evaluation data for sorted and spread groups, p = 0.000107, which is ≪ 0.05 . However, there is a growing feeling that the p-value is not enough for this type of analysis, and that effect sizes are a more appropriate way of comparing two distributions.34 One such measure of effect sizes is the Cohen d. 35 It is defined as:
d=mean1−mean2σpooled
where:
σpooled=√(σ21+σ22)/2
For our evaluation data d = 0.257, which is heuristically characterized as “small.” This characterization of the difference is consistent with what we see in Fig. 5. The 95% confidence interval range for d is 0.126 – 0.388; since this range does not include zero, the difference is statistically significant.
V. DISCUSSION
As discussed, the literature shows clearly that pedagogy with an emphasis on students interacting with each other in small groups has been shown to be effective in promoting conceptual understanding as measured by diagnostic instruments such as the FCI in a prepost-course protocol. In this study, reformed pedagogy is used in both the classes and the Practicals.
Courses that concentrate on conceptual understanding, as we do in our classes and Practicals, have been shown by others36, 37 to have a small impact on the ability of students to solve conventional problems, although this depends on the type of problem. Since, as shown in Table I, conventional problems make up 64% of the grade on the final examination, any effect of different types of Practical teams on exam grades would perhaps be small.
As mentioned in the Introduction, this study attempted to distinguish between two opposing strategies for prescribing the membership of small teams. One strategy is to spread students into mixed teams in order to maximize potential for peer instruction, providing the necessary range of scaffolding to keep weaker students in their most effective zone of proximal development. The other strategy is to sort students into more homogeneous teams, in order to improve the quality of peer interactions by ensuring that each student had teammates they could actually relate to. Our study produced a null result: the makeup of the teams had no measurable effect on student learning.
The normalized gains on the FCI are the same within uncertainties for all types of students in all types of teams. We see indications that a few medium and especially strong students put less effort into the Post-Course FCI: perhaps at the end of the term, when there are many course evaluations occurring in all their courses, they had survey fatigue and since they did receive any credit for answering the questions correctly they did not take it seriously. Of course, this is not an issue for final examination grades. Strong, medium, and weak students as defined by their Pre-Course FCI scores have different mean final examination grades, but those grades are the same for a given student strength regardless of what type of team the student was in.
It is possible to argue that our null results are specific to our particular course. For example, our classes use Peer Instruction and Interactive Lecture Demonstrations extensively: both of these techniques are proven to increase gains on instruments such FCI. In addition, we have the Practicals, which are the main subject of this study. Perhaps the impact of the classes has lessened the sensitivity to effectiveness of different types of teams in the Practicals. If so, a similar study to ours in a course whose classroom component is lecture based, or a course using a Studio Physics model, where the classes, laboratories, and tutorials are integrated, could show some differences in learning for different types of teams. We think this is unlikely, but PER has shown repeatedly that such opinions that are not backed by data should be treated skeptically.
Another course-specific argument is that the course that is discussed here is intended primarily for students in the life sciences, and the median score on the Pre-Course FCI was 50.0%. There is a separate course intended for physics majors and specialists; this course has about 150 students and the median Pre-Course FCI score is typically about 73%. If there were only a single course with both life science and physics majors in it, the FCI scores used to define strong, medium, and weak students would change, and this would tend to increase the difference in ability between strong and weak students in a mixed team. Perhaps with a wider difference in ability, a difference in team effectiveness would be observed, although we think this too is unlikely.
Most teachers have probably noticed that the dynamics or “personality” of small groups of students can be very different for different groups, such as a small course in different years or different conventional tutorial groups for the same course. These variations seem to be greater than one might expect just from the statistics of small groups. Here we have found that student satisfaction with the Practicals was higher for sorted groups by 4σ over spread groups, which is nonetheless characterized as a “small” difference using Cohen’s d. In written comments on the evaluations, 9 students in the spread groups complained about the dynamics of their team, while no students in the sorted groups made a similar complaint. Of course, correlations are not necessarily indicators of causation. And also, of course, the normalized gains on the FCI were the same within uncertainties for the two types of groups.
Lacking such data, we can nonetheless speculate on why there are small but statistically significant differences in student satisfaction depending on the make-up of the teams in the group. Perhaps in the spread groups the best students all ended up feeling a little alone in their teams, while the weaker students felt intimidated by the better students and were less willing to participate. In the sorted groups perhaps there may be more of a feeling that each student “belonged” with his or her partners. So the four best students in Team 1 worked together to produce close to perfect work. Similarly, the four weakest students in Team 9 worked hard as well, and there was always a student in each of the weaker teams who rose to the challenge to become the leader, asking the TA for help and keeping the team focused. Also, in our rooms Teams 1 and 2 were directly across the aisle from Teams 8 and 9, which created some inter-team dialogued.
We tried defining student strength by performance on the first term test, although by this time 60% of the students had already had two 2-hour Practicals with the remainder having had three 2-hour Practicals. We attempted to examine the effectiveness of different types of teams using this definition by comparing student performance on the first term test to performance on the final examination, and also by the normalized gains on the FCI. Perhaps not surprisingly, neither attempt was successful: the data gave no meaningful information on team effectiveness, although they were not obviously inconsistent with the FCI data. We also attempted to increase the number of students being studied by relaxing the definition of types of teams and thereby reducing the uncertainties in our values: we defined a “strongish” team as one of strong students but with 1 medium one, and a “weakish” team as one of weak students but with 1 medium one. This attempt also yielded no meaningful data.
The students in the course studied here are mostly in the life sciences and only 16% of the students self-report that their main reason for taking the course is for their own interest.38 As mentioned, there is a separate freshman course for students intending to be physics majors or specialists, and they are in general much more motivated to learn the material. It would be interesting to do a study similar to this one with that course.
VI. CONCLUSIONS
There are no statistically significant differences in the normalized student gains on the FCI for students in strong, medium, weak, or mixed teams. Although final examination grades are different for different student strengths, there is no statistically significant correlation with the type of team the student was in. There are also no significant differences between students in a team of 3 compared to students in a team of 4, as measured by either the normalised gains on the FCI or by the mean grades on the final examination. Also, the conclusion of previous studies that a team with a single female student should be avoided is not supported by our data. Although there is some indication that students in teams sorted by strength are more satisfied than students in mixed teams, the difference is small.
Based on these results, instructors using team-based pedagogies should consider assigning the teams randomly, as it appears to be just as effective as sorted teams but requires significantly less effort to implement.
Although, as discussed, our data indicate that using Pre-Course FCI scores as a way of classifying student strength is reasonable, if the University of Toronto used SAT scores it would be interesting to use that as a way of classifying students. Perhaps such an experiment would give information that ours did not. Also, as discussed above, replicating our study in a course with traditional lectures plus interactive engagement tutorials, or a Studio Physics course, or in a course with both life science and physics majors could be worthwhile.
Finally, our null result seems to be contrary to the theory of zone of proximal development, which predicts that “spread” teams should have greater learning gains due to the increased effectiveness of scaffolding within teams. One possible way to investigate the amount and type of peer instruction occurring in different types of teams would be to use sociometric badges.39 These devices, about the size of a small TV remote or a classroom clicker, are worn by members of a team and measure the amount of faceto-face interaction, body language and orientation, dynamics of conversation often without recording the actual words being said, and similar properties. The devices and analysis of the “big data” that they produce has successfully been used to measure the characteristics that lead to effective teams in a commercial context, where “effective” is defined as getting a piece of research done, or a product marketed, or similar such tasks. Using these devices and methodology to study effective teams for learning would be an interesting future project.
ACKNOWLEDGEMENTS
We thank April Seeley of the Department of Physics for assistance in collecting the data of this study. We also thank undergraduate student Jody Chan and graduate student Dan Weaver of the Department of Physics for useful discussions on the design of this study. Dan Weaver also gave us useful comments on this paper. We also received many helpful suggestions from the anonymous referees and Charles Henderson, the editor of this journal.
APPENDIX
Here are the five questions about the effectiveness of the Practicals that were on the endof-term anonymous student evaluation.
1. The heart of the learning in the Practicals is you working on the Activities with your Team. Was this an effective way of learning for you?
1. Definitely not
2. Probably not
3. I’m not sure
4. Probably
5. Definitely
2. During the first part of Practicals you worked thorough problems with your team. Was this an effective way of learning for you?
1. Definitely not
2. Probably not
3. I’m not sure
4. Probably
5. Definitely
3. Compared to other labs and tutorials at the same level (1st year U of T), the amount of help available to students during the Practicals is
1. Well Below Average
2. Below Average
3. Average
4. Above Average
5. Well Above Average
4. Is the way we mark your work in the Practicals appropriate and fair?
1. Definitely not
2. Probably not
3. I’m not sure
4. Probably
5. Definitely
5. The time available to complete the assigned activities (not including the “If you have time” activities) was, in general,
1. Not Nearly Enough
2. Not Enough
3. Just Enough
4. More than Enough
5. Much More than Enough
REFERENCES
1 E. Mazur, Peer Instruction: A User’s Manual (Addison-Wesley, New York, 1996).
2 L.C. McDermott, P.S. Schaffer and the Physics Education Group, Tutorials in Introductory Physics (Prentice Hall, New Jersey, 2002).
3 P.W. Laws, Workshop Physics Activity Guide (Wiley, 2004). This type of pedagogy is also sometimes called SCALE-UP, TEAL, and other names.
4 For example, R.G.M. Hausmann, M.T.H.Chi, and M.R. Roy, “Learning from collaborative problem solving: An analysis of three hypothesized mechanisms,” 26nd annual conference of the Cognitive Science Society, 547 (2004). www.cogsci.northwestern.edu/c...s/paper445.pdf (Retrieved November 11, 2014).
5 See, for example, P. Dillenbourg, M. Baker, A. Blaye and C. O’Malley, “The evolution of research on collaborative learning,” in E. Spada and P. Reiman (eds.) Learning in Humans and Machine: Towards an interdisciplinary learning science (Elsevier, Oxford, 1996), 189. tecfa.unige.ch/tecfa/publicat/dil-papers-2/Dil.7.1.10.pdf (Retrieved November 11, 2014).
6 One of the earliest examples which we know of is J. Clement, “Students’ preconceptions in introductory mechanics,” Am. J. Phys. 50(1), 66 (1982). A more recent example, with Clement as a co-author, is A.L Stephens and J. Clement, “Documenting the use of expert scientific reasoning processes by high school physics students,” Phys. Rev. ST PER 6, 020122 (2010).
7 P. Heller, R. Keith, and S. Anderson, “Teaching problem solving through cooperative grouping. Part 1: Group versus individual problem solving”, Am. J. Phys. 60, 627 (1992).
8 P. Heller, R. Keith, and S. Anderson, “Teaching problem solving through cooperative grouping. Part 2: Designing problems and structuring groups”, Am. J. Phys. 60, 637 (1992).
9 J.L. Jensen and A. Lawson, “Effects of Collaborative Group Composition and Inquiry Instruction on Reasoning Gains and Achievement in Undergraduate Biology,” CBE Life Sci. Educ 10, 64 (2011).
10 L.S. Vygotsky, “The genesis of higher mental functions,” The Concept of Activity in Soviet Psychology, J.F. Wertsch, ed. (Sharpe, Armonk N.Y., 1981), 134-240.
11 J. Tudge, ‘Vygotsky, the zone of proximal development, and peer collaboration: implications for classroom practices,” Vygotsky and Education: Instructional Implications and Applications of Sociohistorical Psychology, L. Moll, ed. (Cambridge University Press, N.Y., 1990), 155-172.
12 D. Hestenes, M. Wells and G. Swackhammer, "Force Concept Inventory," The Physics Teacher 30(3), 141 (1992).
13 Available from modeling.asu.edu/R&E/Research.html
14 C.H. Crouch and E. Mazur, “Peer Instruction: Ten years of experience and results,” Am. J. Phys. 69(9), 970 (2001).
15 A.P. Fagen, C.H. Crouch, and E. Mazur, “Peer Instruction: Results from a Range of Classrooms,” The Physics Teacher 40(4), 206 (2002).
16 R.R. Hake, “Interactive-engagement versus traditional methods: A six-thousandstudent survey of mechanics test data for introductory physics courses,” Am. J. Phys. 66(1), 64 (1998).
17 S. Freeman et al., “Active learning increased student performance in science, engineering, and mathematics,” PNAS 111(23), 8410 (2014).
18 R.K. Thornton and D.R. Sokoloff, “Assessing student learning on Newton’s Laws: The Force and Motion Conceptual Evaluation and the Evaluation of Active Learning Laboratory and Lecture Curricula,” Am. J. Phys. 66(4), 338 (1998).
19 C. Hoellwarth and M.J. Moelter, “The implications of a robust curriculum in introductory mechanics,” Am. J. Phys. 79(5), 540 (2011).
20 V.P. Colletta, Thinking in Physics (Pearson, San Francisco, 2015).
21 J.J.B. Harlow, D.M. Harrison, and E. Honig, “Compressed-format compared to regular-format in a first-year university physics course,” Am. J. Phys. 83(3), 272 (2015).
22 Randall D. Knight, Physics for Scientists and Engineers: A Strategic Approach, 3rd ed. (Pearson, Toronto, 2013).
23 D.R. Sokoloff and R.K. Thornton, “Using Interactive Lecture Demonstrations to Create an Active Learning Environment,” The Physics Teacher 35(6), 340 (1997).
24 The U of T Practicals web site is: http://www.upscale.utoronto.ca/Practicals/ .
25 www.pearsonmylabandmastering....teringphysics/
26 D. Huffman and P. Heller, “What Does the Force Concept Inventory Actually Measure?” The Physics Teacher 33(3), 138 (1995).
27 The student guide is at: www.upscale.utoronto.ca/Pract...ork_Module.pdf
28 R. McGill, J.W. Tukey, and W.A. Larsen, “Variations of box plots,” American Statistician 32, 12 (1978). amstat.tandfonline.com/doi/pd....1978.10479236 (Retrieved November 15, 2014). Note that in this article the multiplier is 1.57, not 1.58: since the uncertainty itself is largely heuristic, the difference in these values is trivial.
29 Often the uncertainty in a value is called its “error”. Particularly for students, this word is misleading since it implies that some mistake has been made. This language issue is why, for example, it is Heisenberg’s uncertainty principle, not Heisenberg’s error principle. However, some standard phrases use the word “error,” such as the standard error of the mean. Here we enclose such phrases in quotation marks to remind us that the language of the phrase is poor.
30 See, for example, D.M. Harrison, “Designing a Good Test,” unpublished (1999). Available at: www.upscale.utoronto.ca/PVB/H...estDesign.html
31 There are various conventions for the cutoff definition. We use 1.5 times the interquartile range extending from the upper and lower quartiles, which was proposed in J.D. Emerson and J. Strenio, “Boxplots and Batch Comparison,” in D.C. Hoaglin, F. Mosteller, and J.W. Tukey eds., Understanding Robust and Exploratory Data Analysis (Wiley-Interscience, Toronto, 1983), p. 58. This cutoff definition is the usual one.
32 C. Henderson, “Common Concerns About the Force Concept Inventory,” Phys. Teach. 40, 542 (2002).
33 See, for example, E.M. Pugh and G.H. Winslow, The Analysis of Physical Measurements (Addison-Wesley, Don Mills Ontario, 1966), pg. 172 ff., or the Wikipedia 20 entry “Student’s t-test,” http://en.Wikipedia.org/wiki/Student%27s_t-test (Retrieved May 2, 2013).
34 For example G.M. Sullivan and R. Feinn, “Using Effect Size – or Why the P Value is not Enough,” J. Grad. Med. Educ. 4(3), 279 (2012).
35 J. Cohen, “A power primer,” Psychological Bulletin 112(1), 155 (1992).
36 E.F. Redish, Teaching Physics with the Physics Suite (Wiley, 2003), p. 150.
37 D. Hoellwarth, M.J. Moelter, and R.D. Knight, “A direct comparison of conceptual learning and problem solving ability in traditional and studio style classrooms,” Am. J. Phys. 73(5), 459 (2005).
38 J.J.B. Harlow, D.M. Harrison, and A. Meyertholen, “Correlating student interest and high school preparation with learning and performance in an introductory university physics course,” Phys. Rev. ST PER 10, 010112 (2014).
39 A. Pentland, Social Physics (Penguin, New York, 2014).