
17.9: Binary Alloys


- Last updated
- Sep 10, 2020
- Save as PDF

( \newcommand{\kernel}{\mathrm{null}\,}\)
(This section is a little out of order, and might be better read after Section 17.3.)
If two metals are melted together, and subsequently cooled and solidified, interesting phenomena occur. In this section we look at the way tin and lead mix. I do this in an entirely schematic and idealized way. The details are bit more complicated (and interesting!) than I present them here. For the detailed description and more exact numbers, the reader can refer to the specialized literature, such as Constitution of Binary Alloys by M. Hansen and K. Anderko and its subsequent Second Supplement by F. A. Shunk. In my simplified description I am assuming that when tin and lead are melted, the two liquids are completely miscible, but, when the liquid is cooled, the two metals crystallize out separately. The phenomena are illustrated schematically in the figure below, which is a graph of melting point versus composition of the alloy at a given constant pressure (one atmosphere).
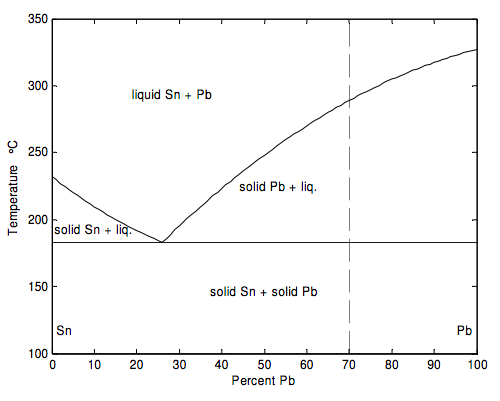
The melting point of pure Pb is 327 ºC
The melting point of pure Sn is 232 ºC
In studying the diagram, let us start at the upper end of the dashed line, where the temperature is 350 ºC and we are dealing with a mixture of 70 percent Pb and 30 percent Sn (by mole – that is to say, by relative numbers of atoms, not by relative mass). If you review the definitions of phase, component, and degrees of freedom, and the Gibbs phase rule, from Section 17.3, you will agree that there is just one phase and one component (there’s no need to tell me the percentage of Sn if you have already told me the percentage of Pb), and that you can vary two intensive state variables (e.g. temperature and pressure) without changing the number of phases.
Now, keeping the composition and pressure constant, let us move down the isopleth (i.e down the dashed line of constant composition). Even after the temperature is lower than 327 ºC, the mixture doesn’t solidify. Nothing happens until the temperature is about 289 ºC. Below that temperature, crystals of Pb start to solidify. The full curve represents the melting point, or solidification point, of Pb as a function of the composition of the liquid. Of course, as some Pb solidifies, the composition of the liquid changes to one of a lesser percentage of Pb, and the composition of the liquid moves down the melting point curve. As long as the liquid is at a temperature and composition indicated along this curve, there is only one remaining degree of freedom (pressure). You cannot change both the temperature and the composition without changing the number of phases. As the temperature is lowered further and further, more Pb solidifies, and the composition of the liquid moves further and further along the curve to the left, until it reaches the eutectic point at a temperature of 183 ºC and a composition of 26% Pb. Below that temperature, both Pb and Sn crystallize out.
If we had started with a composition of less than 26% Pb, Sn would have started to crystallize out as soon as we had reached the left hand curve, and the composition of the liquid would move along that curve to the right until it had reached the eutectic point.
Below, we show similar (highly idealized and schematic) eutectic curves for Pb-Bi and for Bi-Sn. (For more precise descriptions, and more exact numbers, see the literature, such as the references cited above). The data for these three alloys are:
For the pure metals:
Melting point
Pb 327 ºC
Bi 271
Sn 232
Sn-Pb Eutectic 183 ºC 26% Pb
Pb-Bi Eutectic 125 ºC 56% Bi
Bi-Sn Eutectic 139 ºC 57% Sn