
1.2: Activities
- Page ID
- 32425

\( \newcommand{\vecs}[1]{\overset { \scriptstyle \rightharpoonup} {\mathbf{#1}} } \)
\( \newcommand{\vecd}[1]{\overset{-\!-\!\rightharpoonup}{\vphantom{a}\smash {#1}}} \)
\( \newcommand{\dsum}{\displaystyle\sum\limits} \)
\( \newcommand{\dint}{\displaystyle\int\limits} \)
\( \newcommand{\dlim}{\displaystyle\lim\limits} \)
\( \newcommand{\id}{\mathrm{id}}\) \( \newcommand{\Span}{\mathrm{span}}\)
( \newcommand{\kernel}{\mathrm{null}\,}\) \( \newcommand{\range}{\mathrm{range}\,}\)
\( \newcommand{\RealPart}{\mathrm{Re}}\) \( \newcommand{\ImaginaryPart}{\mathrm{Im}}\)
\( \newcommand{\Argument}{\mathrm{Arg}}\) \( \newcommand{\norm}[1]{\| #1 \|}\)
\( \newcommand{\inner}[2]{\langle #1, #2 \rangle}\)
\( \newcommand{\Span}{\mathrm{span}}\)
\( \newcommand{\id}{\mathrm{id}}\)
\( \newcommand{\Span}{\mathrm{span}}\)
\( \newcommand{\kernel}{\mathrm{null}\,}\)
\( \newcommand{\range}{\mathrm{range}\,}\)
\( \newcommand{\RealPart}{\mathrm{Re}}\)
\( \newcommand{\ImaginaryPart}{\mathrm{Im}}\)
\( \newcommand{\Argument}{\mathrm{Arg}}\)
\( \newcommand{\norm}[1]{\| #1 \|}\)
\( \newcommand{\inner}[2]{\langle #1, #2 \rangle}\)
\( \newcommand{\Span}{\mathrm{span}}\) \( \newcommand{\AA}{\unicode[.8,0]{x212B}}\)
\( \newcommand{\vectorA}[1]{\vec{#1}} % arrow\)
\( \newcommand{\vectorAt}[1]{\vec{\text{#1}}} % arrow\)
\( \newcommand{\vectorB}[1]{\overset { \scriptstyle \rightharpoonup} {\mathbf{#1}} } \)
\( \newcommand{\vectorC}[1]{\textbf{#1}} \)
\( \newcommand{\vectorD}[1]{\overrightarrow{#1}} \)
\( \newcommand{\vectorDt}[1]{\overrightarrow{\text{#1}}} \)
\( \newcommand{\vectE}[1]{\overset{-\!-\!\rightharpoonup}{\vphantom{a}\smash{\mathbf {#1}}}} \)
\( \newcommand{\vecs}[1]{\overset { \scriptstyle \rightharpoonup} {\mathbf{#1}} } \)
\(\newcommand{\longvect}{\overrightarrow}\)
\( \newcommand{\vecd}[1]{\overset{-\!-\!\rightharpoonup}{\vphantom{a}\smash {#1}}} \)
\(\newcommand{\avec}{\mathbf a}\) \(\newcommand{\bvec}{\mathbf b}\) \(\newcommand{\cvec}{\mathbf c}\) \(\newcommand{\dvec}{\mathbf d}\) \(\newcommand{\dtil}{\widetilde{\mathbf d}}\) \(\newcommand{\evec}{\mathbf e}\) \(\newcommand{\fvec}{\mathbf f}\) \(\newcommand{\nvec}{\mathbf n}\) \(\newcommand{\pvec}{\mathbf p}\) \(\newcommand{\qvec}{\mathbf q}\) \(\newcommand{\svec}{\mathbf s}\) \(\newcommand{\tvec}{\mathbf t}\) \(\newcommand{\uvec}{\mathbf u}\) \(\newcommand{\vvec}{\mathbf v}\) \(\newcommand{\wvec}{\mathbf w}\) \(\newcommand{\xvec}{\mathbf x}\) \(\newcommand{\yvec}{\mathbf y}\) \(\newcommand{\zvec}{\mathbf z}\) \(\newcommand{\rvec}{\mathbf r}\) \(\newcommand{\mvec}{\mathbf m}\) \(\newcommand{\zerovec}{\mathbf 0}\) \(\newcommand{\onevec}{\mathbf 1}\) \(\newcommand{\real}{\mathbb R}\) \(\newcommand{\twovec}[2]{\left[\begin{array}{r}#1 \\ #2 \end{array}\right]}\) \(\newcommand{\ctwovec}[2]{\left[\begin{array}{c}#1 \\ #2 \end{array}\right]}\) \(\newcommand{\threevec}[3]{\left[\begin{array}{r}#1 \\ #2 \\ #3 \end{array}\right]}\) \(\newcommand{\cthreevec}[3]{\left[\begin{array}{c}#1 \\ #2 \\ #3 \end{array}\right]}\) \(\newcommand{\fourvec}[4]{\left[\begin{array}{r}#1 \\ #2 \\ #3 \\ #4 \end{array}\right]}\) \(\newcommand{\cfourvec}[4]{\left[\begin{array}{c}#1 \\ #2 \\ #3 \\ #4 \end{array}\right]}\) \(\newcommand{\fivevec}[5]{\left[\begin{array}{r}#1 \\ #2 \\ #3 \\ #4 \\ #5 \\ \end{array}\right]}\) \(\newcommand{\cfivevec}[5]{\left[\begin{array}{c}#1 \\ #2 \\ #3 \\ #4 \\ #5 \\ \end{array}\right]}\) \(\newcommand{\mattwo}[4]{\left[\begin{array}{rr}#1 \amp #2 \\ #3 \amp #4 \\ \end{array}\right]}\) \(\newcommand{\laspan}[1]{\text{Span}\{#1\}}\) \(\newcommand{\bcal}{\cal B}\) \(\newcommand{\ccal}{\cal C}\) \(\newcommand{\scal}{\cal S}\) \(\newcommand{\wcal}{\cal W}\) \(\newcommand{\ecal}{\cal E}\) \(\newcommand{\coords}[2]{\left\{#1\right\}_{#2}}\) \(\newcommand{\gray}[1]{\color{gray}{#1}}\) \(\newcommand{\lgray}[1]{\color{lightgray}{#1}}\) \(\newcommand{\rank}{\operatorname{rank}}\) \(\newcommand{\row}{\text{Row}}\) \(\newcommand{\col}{\text{Col}}\) \(\renewcommand{\row}{\text{Row}}\) \(\newcommand{\nul}{\text{Nul}}\) \(\newcommand{\var}{\text{Var}}\) \(\newcommand{\corr}{\text{corr}}\) \(\newcommand{\len}[1]{\left|#1\right|}\) \(\newcommand{\bbar}{\overline{\bvec}}\) \(\newcommand{\bhat}{\widehat{\bvec}}\) \(\newcommand{\bperp}{\bvec^\perp}\) \(\newcommand{\xhat}{\widehat{\xvec}}\) \(\newcommand{\vhat}{\widehat{\vvec}}\) \(\newcommand{\uhat}{\widehat{\uvec}}\) \(\newcommand{\what}{\widehat{\wvec}}\) \(\newcommand{\Sighat}{\widehat{\Sigma}}\) \(\newcommand{\lt}{<}\) \(\newcommand{\gt}{>}\) \(\newcommand{\amp}{&}\) \(\definecolor{fillinmathshade}{gray}{0.9}\)a. Imagine a piston containing a sample of ideal gas. Assume the piston head is perfectly free to move, unless locked in place, and the walls of the piston readily allow the transfer of energy via heat, unless wrapped in insulation. The gas is at the pressure and volume indicated on the graph below and is in equilibrium with a large thermal reservoir at room temperature. Draw a curve, labeled with the appropriate number, to represent each of the following actions. After each action the piston is reset to its initial equilibrium state.
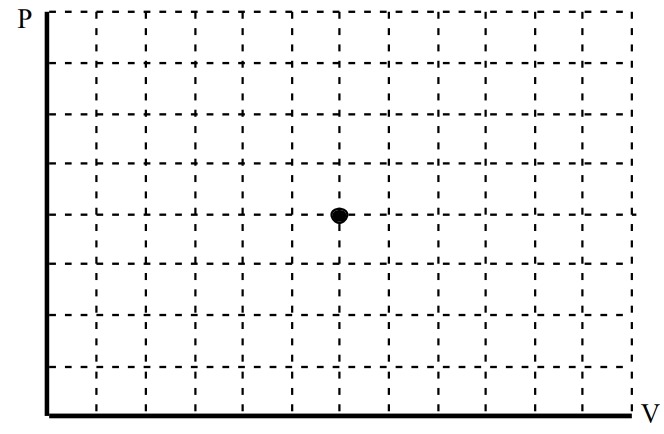
- Lock the piston head in place. Hold the piston above a very hot flame.
- Slowly push the piston down.
- Pull the piston up abruptly.
- Plunge the piston into very cold water.
- Wrap the piston in insulation. Slowly pull the piston up.
b. For each of the actions, state whether the energy transferred to the gas via work, the energy transferred to the gas via heat, and the change in the internal energy of the gas are positive, negative, or zero.
| Action | W | Q | \(\Delta \mathrm{U}\) |
|---|---|---|---|
| 1 | |||
| 2 | |||
| 3 | |||
| 4 | |||
| 5 |
a. Imagine a piston containing a sample of ideal gas. Assume the piston head is perfectly free to move, unless locked in place, and the walls of the piston readily allow the transfer of energy via heat, unless wrapped in insulation. The gas is at the temperature and volume indicated on the graph below and is in equilibrium with a large thermal reservoir at room temperature. Draw a curve, labeled with the appropriate number, to represent each of the following actions. After each action the piston is reset to its initial equilibrium state.
- Hold the piston above a very hot flame.
- Push the piston down abruptly.
- Wrap the piston in insulation. Slowly push the piston down.
- Lock the piston head in place. Plunge the piston into very cold water.
- Slowly pull the piston up.
b. For each of the actions, state whether the energy transferred to the gas via work, the energy transferred to the gas via heat, and the change in the internal energy of the gas are positive, negative, or zero.
| Action | W | Q | \(\Delta \mathrm{U}\) |
|---|---|---|---|
| 1 | |||
| 2 | |||
| 3 | |||
| 4 | |||
| 5 |
a. Imagine a piston containing a sample of ideal gas. Assume the piston head is perfectly free to move, unless locked in place, and the walls of the piston readily allow the transfer of energy via heat, unless wrapped in insulation. The gas is at the temperature and pressure indicated on the graph below and is in equilibrium with a large thermal reservoir at room temperature. Draw a curve, labeled with the appropriate number, to represent each of the following actions. After each action the piston is reset to its initial equilibrium state.
- Hold the piston above a very hot flame.
- Push the piston down abruptly.
- Wrap the piston in insulation. Slowly push the piston down.
- Lock the piston head in place. Plunge the piston into very cold water.
- Slowly pull the piston up.
b. For each of the actions, state whether the energy transferred to the gas via work, the energy transferred to the gas via heat, and the change in the internal energy of the gas are positive, negative, or zero.
| Action | W | Q | \(\Delta \mathrm{U}\) |
|---|---|---|---|
| 1 | |||
| 2 | |||
| 3 | |||
| 4 | |||
| 5 |
Below are representations of six thermodynamic states of the same ideal gas sample.
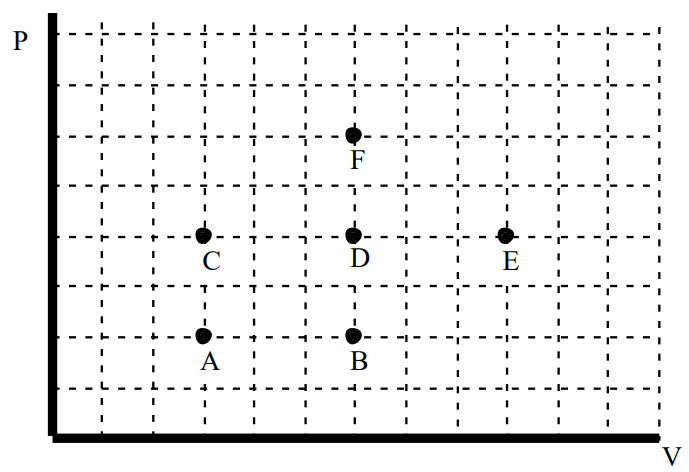
Rank the states on the basis of the temperature of the gas sample at each state.
Largest 1. _____ 2. _____ 3. _____ 4. _____ 5. _____ 6. _____ Smallest
_____ The ranking cannot be determined based on the information provided.
Explain the reason for your ranking:
Below are representations of six thermodynamic states of the same ideal gas sample.
Rank the states on the basis of the volume of the gas sample at each state.
Largest 1. _____ 2. _____ 3. _____ 4. _____ 5. _____ 6. _____ Smallest
_____ The ranking cannot be determined based on the information provided.
Explain the reason for your ranking:
Below are representations of six thermodynamic states of the same ideal gas sample.
Rank the states on the basis of the average kinetic energy of the atoms in the gas sample at each state.
Largest 1. _____ 2. _____ 3. _____ 4. _____ 5. _____ 6. _____ Smallest
_____ The ranking cannot be determined based on the information provided.
Explain the reason for your ranking:
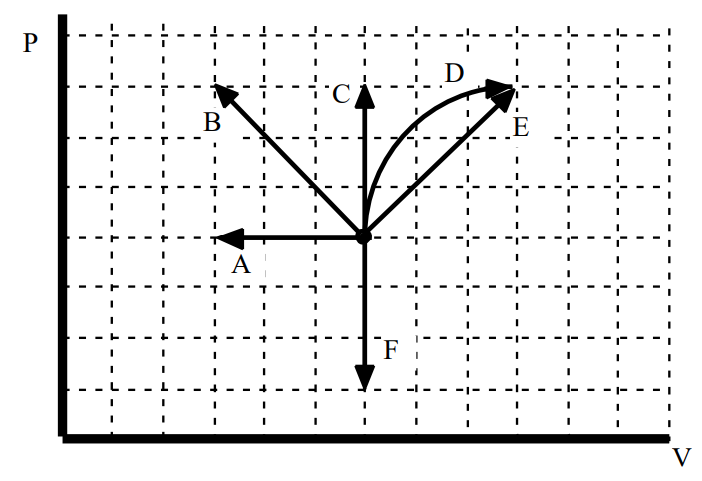
Below are representations of six thermodynamic processes undertaken with the same ideal gas sample starting from the same initial state. Letters near each end-state label each process.
Rank the states on the basis of the average kinetic energy of the atoms in the gas sample at each state.
Largest 1. _____ 2. _____ 3. _____ 4. _____ 5. _____ 6. _____ Smallest
_____ The ranking cannot be determined based on the information provided.
Explain the reason for your ranking:
Below are representations of six thermodynamic processes undertaken with the same ideal gas sample starting from the same initial state. Letters near each end-state label each process.
a. Rank the processes on the basis of the amount of energy transferred to the gas via work during each process.
Largest Positive 1. _____ 2. _____ 3. _____ 4. _____ 5. _____ 6. _____ Largest Negative
_____ The ranking cannot be determined based on the information provided.
Explain the reason for your ranking:
b. Rank the processes on the basis of the change in internal energy of the gas sample.
Largest Positive 1. _____ 2. _____ 3. _____ 4. _____ 5. _____ 6. _____ Largest Negative
_____ The ranking cannot be determined based on the information provided.
Explain the reason for your ranking:
Below are representations of six thermodynamic processes undertaken with the same ideal gas sample. Letters near each end-state label each process.
a. Rank the processes on the basis of the amount of energy transferred to the gas via work during each process.
Largest Positive 1. _____ 2. _____ 3. _____ 4. _____ 5. _____ 6. _____ Largest Negative
_____ The ranking cannot be determined based on the information provided.
Explain the reason for your ranking:
b. Rank the processes on the basis of the change in internal energy of the gas sample.
Largest Positive 1. _____ 2. _____ 3. _____ 4. _____ 5. _____ 6. _____ Largest Negative
_____ The ranking cannot be determined based on the information provided.
Explain the reason for your ranking:
Below are representations of six thermodynamic processes undertaken with the same ideal gas sample starting from the same initial state. Letters near each end-state label each process.
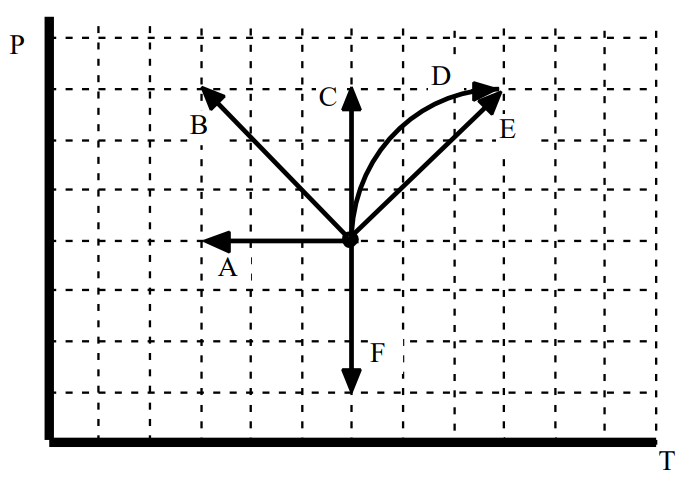
Rank the processes on the basis of the change in internal energy of the gas sample.
Largest Positive 1. _____ 2. _____ 3. _____ 4. _____ 5. _____ 6. _____ Largest Negative
_____ The ranking cannot be determined based on the information provided.
Explain the reason for your ranking:
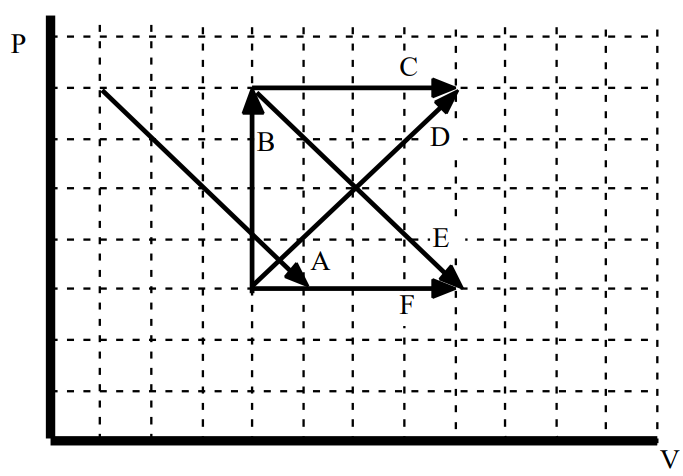
An ideal gas sample is processed between equilibrium states represented by the letters A through F on the pressure vs. volume graph above. All processes connect states via straight line segments.
Compare the energy transferred to the gas via work. Circle the correct comparison symbol.
a. (A to B) > = < ? (B to A)
Explanation:
b. (C to B) > = < ? (B to E)
Explanation:
c. (A to B to D to C to A) > = < ? (C to B to D to F to C)
Explanation:
d. (B to A to C to B) > = < ? (B to C to A to B)
Explanation:
e. (E to F to D to E) > = < ? (B to C to D to B)
Explanation:
An ideal gas sample is processed between equilibrium states represented by the letters A through F on the pressure vs. volume graph above. All processes connect states via straight line segments.
Compare the energy transferred to the gas via heat. Circle the correct comparison symbol.
a. (A to B) > = < ? (B to A)
Explanation:
b. (A to B) > = < ? (A to C)
Explanation:
c. (A to E) > = < ? (A to F)
Explanation:
d. (A to B to D to C to A) > = < ? (C to B to D to F to C)
Explanation:
e. (B to A to C to B) > = < ? (B to C to A to B)
Explanation:
An ideal gas sample is processed between equilibrium states represented by the letters A through F on the pressure vs. volume graph above. All processes connect states via straight line segments.
Compare the change in internal energy of the gas. Circle the correct comparison symbol.
a. (A to B) > = < ? (B to A)
Explanation:
b. (A to D) > = < ? (B to E)
Explanation:
c. (A to B to D to C to A) > = < ? (A to B to C to A)
Explanation:
d. (B to A to C to B) > = < ? (B to C to A to B)
Explanation:
e. (E to F to D to E) > = < ? (B to C to A to B)
Explanation:
What, if anything, is wrong with the following answers? Correct all the mistakes that you find.
1. Can heat be transferred to an ideal gas sample and the sample's temperature remain constant? If so, describe how this could be done.
No. Temperature is a measure of the amount of heat that has been added to a gas. Therefore, if you transfer additional heat to a gas, the temperature of the gas must increase.
2. Must the pressure always increase when the volume of an ideal gas sample is decreased? Why?
Yes. When a gas sample is compressed, the molecules of the sample now must occupy a smaller volume. Thus, they will collide with the walls of the container more often. More collisions mean a higher pressure.
3. Can work be done on an ideal gas sample and the sample's volume remain constant? If so, describe how this could be done.
Normally, when work is done on a gas sample, the gas volume decreases. However, when heat is normally transferred to a gas sample, the gas volume increases. Therefore, it is possible to both do work on the gas, and transfer heat to the gas, in the proper ratio, such that the volume remains constant.
4. Can the volume of an ideal gas sample decrease even though the pressure and temperature remain constant? If so, describe how this could be done.
No. The equation of state of an ideal gas (pV = nRT) clearly indicates that if p and T remain constant, so must V, assuming no gas has leaked out of the sample.
A 5 cubic meter weather balloon is filled with helium at the surface of the earth on a summer (28° C) day. When the balloon reaches an altitude of 6 km, the air pressure has dropped to about half of its original value and the temperature is now - 50° C. Assume the balloon has minimal resistance to expansion.
Thermodynamic Information
| Event 1: | Event 2: |
|---|---|
|
p1 = V1 = T1 = |
p2 = V2 = T2 = |
|
Process: W12 = Q12 = |
|
Mathematical Analysis
A robotic airplane takes off from the surface of the earth on a summer (26° C) day. When the airplane reaches an altitude of 6 km, the temperature outside has dropped to - 50° C. Assume the airplane was sealed shut at the earth’s surface and is made of strong enough material such that its volume does not change.
Thermodynamic Information
| Event 1: | Event 2: |
|---|---|
|
p1 = V1 = T1 = |
p2 = V2 = T2 = |
|
Process: W12 = Q12 = |
|
Mathematical Analysis
Upon leaving your house on a cold (0° C) morning, you check your tire pressure. The gauge reads 32 lb/in2 (2.2 x 10⁵ Pa). Upon arriving at school, the gauge reads 35 lb/in2 . Assume the increase in the volume of the tire is small enough to be ignored. Note that the gauge displays the amount by which the tire pressure exceeds atmospheric pressure.
Thermodynamic Information
| Event 1: | Event 2: |
|---|---|
|
p1 = V1 = T1 = |
p2 = V2 = T2 = |
|
Process: W12 = Q12 = |
|
Mathematical Analysis
Upon leaving your house on a cold (0° C) morning, you check your tire pressure. The gauge reads 32 lb/in2 (2.2 x 10⁵ Pa). Upon arriving at school, the gauge reads 35 lb/in2. Assume the volume of the tire increased by approximately 5% during the drive. Note that the gauge displays the amount by which the tire pressure exceeds atmospheric pressure.
Thermodynamic Information
| Event 1: | Event 2: |
|---|---|
|
p1 = V1 = T1 = |
p2 = V2 = T2 = |
|
Process: W12 = Q12 = |
|
Mathematical Analysis
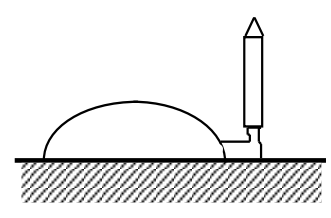
A stomp rocket is a device in which a sample of air trapped in a heavy-duty, hemispherical balloon is very quickly compressed (by stomping on it) causing an abrupt increase in pressure. This increased pressure launches a toy rocket attached to the gas sample by a nozzle. Assume the gas sample is initially at 20° C and 1.0 atm and the volume of the gas sample is decreased by 50% during the stomp.
Thermodynamic Information
| Event 1: | Event 2: |
|---|---|
|
p1 = V1 = T1 = |
p2 = V2 = T2 = |
|
Process: W12 = Q12 = |
|
Mathematical Analysis
A bubble of volume V is formed at the bottom of the ocean and rises to the top. The pressure at the bottom of the ocean is approximately 6 x 10⁷ Pa and the temperature is 3° C. The temperature of the ocean’s surface is approximately 12° C.
Thermodynamic Information
| Event 1: | Event 2: |
|---|---|
|
p1 = V1 = T1 = |
p2 = V2 = T2 = |
|
Process: W12 = Q12 = |
|
Mathematical Analysis
After diving, a diver has a small bubble of oxygen of volume V trapped in his bloodstream. As his heart beats, the bubble’s size varies. His blood pressure is approximately 120 / 80, where ‘120’ is measured in mm of Hg, a unit used to measure pressure. 120 mm of Hg corresponds to a pressure of 1.6 x 10⁴ Pa above atmospheric pressure.
Thermodynamic Information
| Event 1: | Event 2: |
|---|---|
|
p1 = V1 = T1 = |
p2 = V2 = T2 = |
|
Process: W12 = Q12 = |
|
Mathematical Analysis
The pressure in a fluid as a function of depth beneath the surface (for fluids at a uniform temperature) is \(p=p_{o}+\rho g d\), where \(p_{o} \) is the pressure at the surface, \(\rho\) is the density of the fluid, and \(d\) is the distance below the surface. A bubble of volume V is formed at the bottom of a 0.9 m high ‘yard of beer’ and rises to the top. The density of beer is approximately 1.0 x 10³ kg/m3.
Thermodynamic Information
| Event 1: | Event 2: |
|---|---|
|
p1 = V1 = T1 = |
p2 = V2 = T2 = |
|
Process: W12 = Q12 = |
|
Mathematical Analysis
In an automobile engine, an air-fuel mixture initially at atmospheric pressure and 85° C is quickly compressed by a factor of four before ignition. Assume the mixture behaves like an ideal gas.
Thermodynamic Information
| Event 1: | Event 2: |
|---|---|
|
p1 = V1 = T1 = |
p2 = V2 = T2 = |
|
Process: W12 = Q12 = |
|
Mathematical Analysis
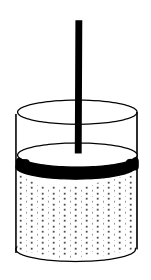
An amateur inventor claims that the following process will “remove heat” from the surroundings of the piston, a water bath at 80° C. Initially, the volume of the gas in the piston is 200 cm3 and the pressure exerted on the piston head is 1.5 atm above atmospheric pressure. The external pressure is quickly removed, leaving only atmospheric pressure on the piston head. Once the gas stops its rapid expansion, the piston head is locked in place and the sample is allowed to return to thermal equilibrium with the water bath.
Thermodynamic Information
|
Event 1: |
Event 2: |
Event 3: |
Event 4: |
Event 5: |
|---|---|---|---|---|
|
p1 = V1 = T1 = |
p2 = V2 = T2 = |
p3 = V3 = T3 = |
p4 = V4 = T4 = |
p5 = V5 = T5 = |
|
Process: W12 = Q12 = |
Process: W23 = Q23 = |
Process: W34 = Q34 = |
Process: W45 = Q45 = |
Mathematical Analysis
An amateur inventor claims that the following process will “remove heat” from the surroundings of the piston, a water bath at 80° C. Initially, the volume of the gas in the piston is 200 cm3 and the pressure exerted on the piston head is 1.5 atm above atmospheric pressure. The external pressure is quickly removed, leaving only atmospheric pressure on the piston head. Once the gas stops its rapid expansion, the piston head is locked in place and the sample is allowed to return to thermal equilibrium with the water bath. Then, the external pressure is slowly increased until the sample returns to its original volume.
Thermodynamic Information
|
Event 1: |
Event 2: |
Event 3: |
Event 4: |
Event 5: |
|---|---|---|---|---|
|
p1 = V1 = T1 = |
p2 = V2 = T2 = |
p3 = V3 = T3 = |
p4 = V4 = T4 = |
p5 = V5 = T5 = |
|
Process: W12 = Q12 = |
Process: W23 = Q23 = |
Process: W34 = Q34 = |
Process: W45 = Q45 = |
Mathematical Analysis
An amateur inventor is unsure what effect the following process will have on the surroundings of the piston, a water bath at 80° C. Initially, the volume of the gas in the piston is 200 cm3 and the pressure exerted on the piston head is 1.5 atm above atmospheric pressure. The external pressure is very slowly removed, until only atmospheric pressure remains on the piston head. Once the gas stops its expansion, an additional external pressure is quickly applied to the piston head until the sample returns to its original volume. Then, the piston head is locked in place and the sample is allowed to return to thermal equilibrium with the water bath.
Thermodynamic Information
|
Event 1:
|
Event 2: |
Event 3: |
Event 4: |
Event 5: |
|
p1 = V1 = T1 = |
p2 = V2 = T2 = |
p3 = V3 = T3 = |
p4 = V4 = T4 = |
p5 = V5 = T5 = |
|
Process: W12 = Q12 = |
Process: W23 = Q23 = |
Process: W34 = Q34 = |
Process: W45 = Q45 = |
Mathematical Analysis
An amateur inventor has no idea what he’s doing. He starts with 400 cm3 of gas in the piston at atmospheric pressure, with the piston in an ice water bath. After locking the piston head in place, he then plunges the piston into a hot water bath (90° C). Once thermal equilibrium is reached, he unlocks the piston head and allows the gas sample to slowly expand. Once the expansion is complete, he returns the sample to the ice water bath (without locking the piston head).
Thermodynamic Information
|
Event 1: |
Event 2: |
Event 3: |
Event 4: |
Event 5: |
|
p1 = V1 = T1 = |
p2 = V2 = T2 = |
p3 = V3 = T3 = |
p4 = V4 = T4 = |
p5 = V5 = T5 = |
|
Process: W12 = Q12 = |
Process: W23 = Q23 = |
Process: W34 = Q34 = |
Process: W45 = Q45 = |
Mathematical Analysis
An amateur inventor has no idea what she’s doing. She starts with 400 cm3 of gas in the piston at atmospheric pressure, with the piston in an ice water bath. Attaching a vacuum pump, she slowly reduces the pressure on the piston head to 0.3 atm. After locking the piston head in place, she removes the vacuum pump. She then places the piston in a flame until the pressure of the gas is once again 1.0 atm. Once this is complete, she unlocks the piston head and she returns the sample to the ice water bath.
Thermodynamic Information
|
Event 1: |
Event 2: |
Event 3: |
Event 4: |
Event 5: |
|
p1 = V1 = T1 = |
p2 = V2 = T2 = |
p3 = V3 = T3 = |
p4 = V4 = T4 = |
p5 = V5 = T5 = |
|
Process: W12 = Q12 = |
Process: W23 = Q23 = |
Process: W34 = Q34 = |
Process: W45 = Q45 = |
Mathematical Analysis
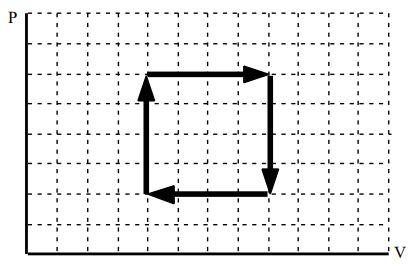
In a certain industrial process, thirty moles of gas are processed through the cycle at right. The gas begins the cycle at a pressure of 1.5 atm and temperature 300 K. The first step of the cycle is an expansion to twice the initial volume. The minimum temperature of the gas during the cycle is 180 K. The graph is not to scale.
Thermodynamic Information
|
Event 1: |
Event 2: |
Event 3: |
Event 4: |
Event 5: |
|
p1 = V1 = T1 = |
p2 = V2 = T2 = |
p3 = V3 = T3 = |
p4 = V4 = T4 = |
p5 = V5 = T5 = |
|
Process: W12 = Q12 = |
Process: W23 = Q23 = |
Process: W34 = Q34 = |
Process: W45 = Q45 = |
Mathematical Analysis
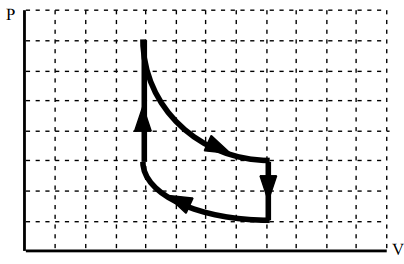
In a certain industrial process, a gas sample is processed through the cycle at right. The gas starts at a pressure of 2 atm, volume of 0.6 m3 and a temperature of 450 K. The gas expands isothermally (at constant temperature) to twice its original volume. The pressure is then decreased at constant volume. The gas is then isothermally compressed to its original volume and a pressure of 1.7 atm. The gas is then returned to its initial state. The graph is not to scale.
Thermodynamic Information
|
Event 1:
|
Event 2: |
Event 3: |
Event 4: |
Event 5: |
|
p1 = V1 = T1 = |
p2 = V2 = T2 = |
p3 = V3 = T3 = |
p4 = V4 = T4 = |
p5 = V5 = T5 = |
|
Process: W12 = Q12 = |
Process: W23 = Q23 = |
Process: W34 = Q34 = |
Process: W45 = Q45 = |
Mathematical Analysis