
31A: Strings, Air Columns
- Page ID
- 5024

\( \newcommand{\vecs}[1]{\overset { \scriptstyle \rightharpoonup} {\mathbf{#1}} } \)
\( \newcommand{\vecd}[1]{\overset{-\!-\!\rightharpoonup}{\vphantom{a}\smash {#1}}} \)
\( \newcommand{\dsum}{\displaystyle\sum\limits} \)
\( \newcommand{\dint}{\displaystyle\int\limits} \)
\( \newcommand{\dlim}{\displaystyle\lim\limits} \)
\( \newcommand{\id}{\mathrm{id}}\) \( \newcommand{\Span}{\mathrm{span}}\)
( \newcommand{\kernel}{\mathrm{null}\,}\) \( \newcommand{\range}{\mathrm{range}\,}\)
\( \newcommand{\RealPart}{\mathrm{Re}}\) \( \newcommand{\ImaginaryPart}{\mathrm{Im}}\)
\( \newcommand{\Argument}{\mathrm{Arg}}\) \( \newcommand{\norm}[1]{\| #1 \|}\)
\( \newcommand{\inner}[2]{\langle #1, #2 \rangle}\)
\( \newcommand{\Span}{\mathrm{span}}\)
\( \newcommand{\id}{\mathrm{id}}\)
\( \newcommand{\Span}{\mathrm{span}}\)
\( \newcommand{\kernel}{\mathrm{null}\,}\)
\( \newcommand{\range}{\mathrm{range}\,}\)
\( \newcommand{\RealPart}{\mathrm{Re}}\)
\( \newcommand{\ImaginaryPart}{\mathrm{Im}}\)
\( \newcommand{\Argument}{\mathrm{Arg}}\)
\( \newcommand{\norm}[1]{\| #1 \|}\)
\( \newcommand{\inner}[2]{\langle #1, #2 \rangle}\)
\( \newcommand{\Span}{\mathrm{span}}\) \( \newcommand{\AA}{\unicode[.8,0]{x212B}}\)
\( \newcommand{\vectorA}[1]{\vec{#1}} % arrow\)
\( \newcommand{\vectorAt}[1]{\vec{\text{#1}}} % arrow\)
\( \newcommand{\vectorB}[1]{\overset { \scriptstyle \rightharpoonup} {\mathbf{#1}} } \)
\( \newcommand{\vectorC}[1]{\textbf{#1}} \)
\( \newcommand{\vectorD}[1]{\overrightarrow{#1}} \)
\( \newcommand{\vectorDt}[1]{\overrightarrow{\text{#1}}} \)
\( \newcommand{\vectE}[1]{\overset{-\!-\!\rightharpoonup}{\vphantom{a}\smash{\mathbf {#1}}}} \)
\( \newcommand{\vecs}[1]{\overset { \scriptstyle \rightharpoonup} {\mathbf{#1}} } \)
\(\newcommand{\longvect}{\overrightarrow}\)
\( \newcommand{\vecd}[1]{\overset{-\!-\!\rightharpoonup}{\vphantom{a}\smash {#1}}} \)
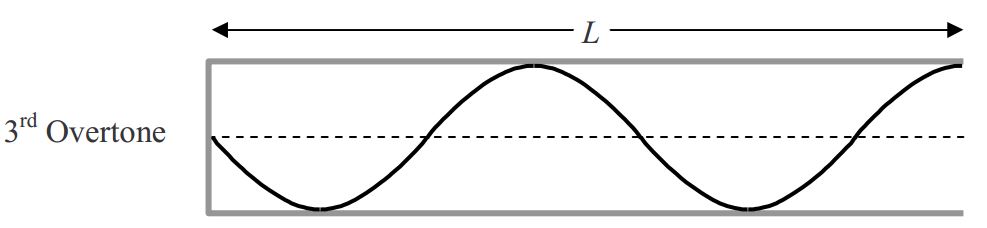
\(\newcommand{\avec}{\mathbf a}\) \(\newcommand{\bvec}{\mathbf b}\) \(\newcommand{\cvec}{\mathbf c}\) \(\newcommand{\dvec}{\mathbf d}\) \(\newcommand{\dtil}{\widetilde{\mathbf d}}\) \(\newcommand{\evec}{\mathbf e}\) \(\newcommand{\fvec}{\mathbf f}\) \(\newcommand{\nvec}{\mathbf n}\) \(\newcommand{\pvec}{\mathbf p}\) \(\newcommand{\qvec}{\mathbf q}\) \(\newcommand{\svec}{\mathbf s}\) \(\newcommand{\tvec}{\mathbf t}\) \(\newcommand{\uvec}{\mathbf u}\) \(\newcommand{\vvec}{\mathbf v}\) \(\newcommand{\wvec}{\mathbf w}\) \(\newcommand{\xvec}{\mathbf x}\) \(\newcommand{\yvec}{\mathbf y}\) \(\newcommand{\zvec}{\mathbf z}\) \(\newcommand{\rvec}{\mathbf r}\) \(\newcommand{\mvec}{\mathbf m}\) \(\newcommand{\zerovec}{\mathbf 0}\) \(\newcommand{\onevec}{\mathbf 1}\) \(\newcommand{\real}{\mathbb R}\) \(\newcommand{\twovec}[2]{\left[\begin{array}{r}#1 \\ #2 \end{array}\right]}\) \(\newcommand{\ctwovec}[2]{\left[\begin{array}{c}#1 \\ #2 \end{array}\right]}\) \(\newcommand{\threevec}[3]{\left[\begin{array}{r}#1 \\ #2 \\ #3 \end{array}\right]}\) \(\newcommand{\cthreevec}[3]{\left[\begin{array}{c}#1 \\ #2 \\ #3 \end{array}\right]}\) \(\newcommand{\fourvec}[4]{\left[\begin{array}{r}#1 \\ #2 \\ #3 \\ #4 \end{array}\right]}\) \(\newcommand{\cfourvec}[4]{\left[\begin{array}{c}#1 \\ #2 \\ #3 \\ #4 \end{array}\right]}\) \(\newcommand{\fivevec}[5]{\left[\begin{array}{r}#1 \\ #2 \\ #3 \\ #4 \\ #5 \\ \end{array}\right]}\) \(\newcommand{\cfivevec}[5]{\left[\begin{array}{c}#1 \\ #2 \\ #3 \\ #4 \\ #5 \\ \end{array}\right]}\) \(\newcommand{\mattwo}[4]{\left[\begin{array}{rr}#1 \amp #2 \\ #3 \amp #4 \\ \end{array}\right]}\) \(\newcommand{\laspan}[1]{\text{Span}\{#1\}}\) \(\newcommand{\bcal}{\cal B}\) \(\newcommand{\ccal}{\cal C}\) \(\newcommand{\scal}{\cal S}\) \(\newcommand{\wcal}{\cal W}\) \(\newcommand{\ecal}{\cal E}\) \(\newcommand{\coords}[2]{\left\{#1\right\}_{#2}}\) \(\newcommand{\gray}[1]{\color{gray}{#1}}\) \(\newcommand{\lgray}[1]{\color{lightgray}{#1}}\) \(\newcommand{\rank}{\operatorname{rank}}\) \(\newcommand{\row}{\text{Row}}\) \(\newcommand{\col}{\text{Col}}\) \(\renewcommand{\row}{\text{Row}}\) \(\newcommand{\nul}{\text{Nul}}\) \(\newcommand{\var}{\text{Var}}\) \(\newcommand{\corr}{\text{corr}}\) \(\newcommand{\len}[1]{\left|#1\right|}\) \(\newcommand{\bbar}{\overline{\bvec}}\) \(\newcommand{\bhat}{\widehat{\bvec}}\) \(\newcommand{\bperp}{\bvec^\perp}\) \(\newcommand{\xhat}{\widehat{\xvec}}\) \(\newcommand{\vhat}{\widehat{\vvec}}\) \(\newcommand{\uhat}{\widehat{\uvec}}\) \(\newcommand{\what}{\widehat{\wvec}}\) \(\newcommand{\Sighat}{\widehat{\Sigma}}\) \(\newcommand{\lt}{<}\) \(\newcommand{\gt}{>}\) \(\newcommand{\amp}{&}\) \(\definecolor{fillinmathshade}{gray}{0.9}\)Be careful not to jump to any conclusions about the wavelength of a standing wave. Folks will do a nice job drawing a graph of Displacement vs. Position Along the Medium and then interpret it incorrectly. For instance, look at the diagram on this page. Folks see that a half wavelength fits in the string segment and quickly write the wavelength as \(\lambda =\frac{1}{2} L\). But this equation says that a whole wavelength fits in half the length of the string. This is not at all the case. Rather than recognizing that the fraction \(\frac{1}{2}\) is relevant and quickly using that fraction in an expression for the wavelength, one needs to be more systematic. First write what you see, in the form of an equation, and then solve that equation for the wavelength. For instance, in the diagram below we see that one half a wavelength \(\lambda\) fits in the length \(L\) of the string. Writing this in equation form yields \(\frac{1}{2} \lambda=L\). Solving this for \(\lambda\) yields \(\lambda= 2L\).
One can determine the wavelengths of standing waves in a straightforward manner and obtain the frequencies from
\[v\space =\lambda f \nonumber \]
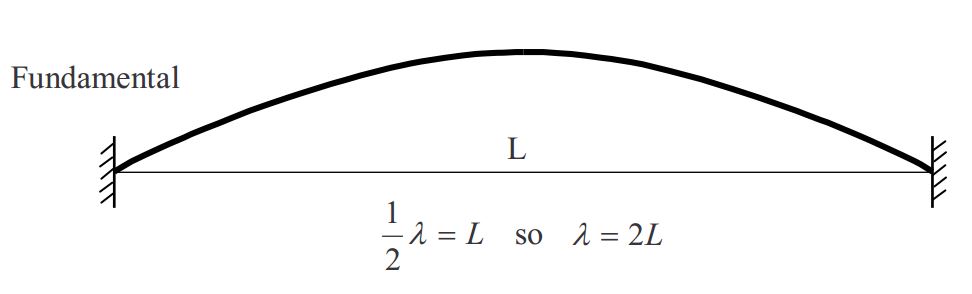
where the wave speed \(v\) is determined by the tension and linear mass density of the string. The method depends on the boundary conditions—the conditions at the ends of the wave medium. (The wave medium is the substance [string, air, water, etc.] through which the wave is traveling. The wave medium is what is “waving.”) Consider the case of waves in a string. A fixed end forces there to be a node at that end because the end of the string cannot move. (A node is a point on the string at which the interference is always destructive, resulting in no oscillations. An antinode is a point at which the interference is always constructive, resulting in maximal oscillations.) A free end forces there to be an antinode at that end because at a free end the wave reflects back on itself without phase reversal (a crest reflects as a crest and a trough reflects as a trough) so at a free end you have one and the same part of the wave traveling in both directions along the string. The wavelength condition for standing waves is that the wave must “fit” in the string segment in a manner consistent with the boundary conditions. For a string of length \(L\) fixed at both ends, we can meet the boundary conditions if half a wavelength is equal to the length of the string.
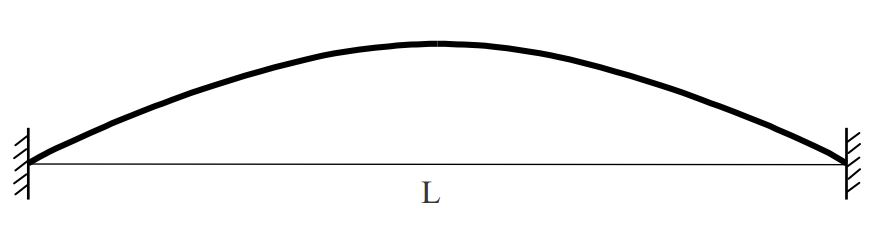
Such a wave “fits” the string in the sense that whenever a zero-displacement part of the wave is aligned with one fixed end of the string another zero-displacement part of the wave is aligned with the other fixed end of the string.
Since half a wavelength fits in the string segment we have:
\[\frac{1}{2}\lambda=L \nonumber \]
\[\lambda=2L \nonumber \]
Given the wave speed \(v\), the frequency can be solved for as follows:
\[v=\lambda f \nonumber \]
\[f=\frac{v}{\lambda} \nonumber \]
\[f=\frac{v}{2L} \nonumber \]
It should be noted that despite the fact that the wave is called a standing wave and the fact that it is typically depicted at an instant in time when an antinode on the string is at its maximum displacement from its equilibrium position, all parts of the string (except the nodes) do oscillate about their equilibrium position.
Note that, while the interference at the antinode, the point in the middle of the string in the case at hand, is always as constructive as possible, that does not mean that the string at that point is always at maximum displacement. At times, at that location, there is indeed a crest interfering with a crest, but at other times, there is a zero displacement part of the wave interfering with a zero-displacement part of the wave, at times a trough interfering with a trough, and at times, an intermediate-displacement part of the wave interfering with the same intermediate-displacement part of the wave traveling in the opposite direction. All of this corresponds to the antinode oscillating about its equilibrium position.
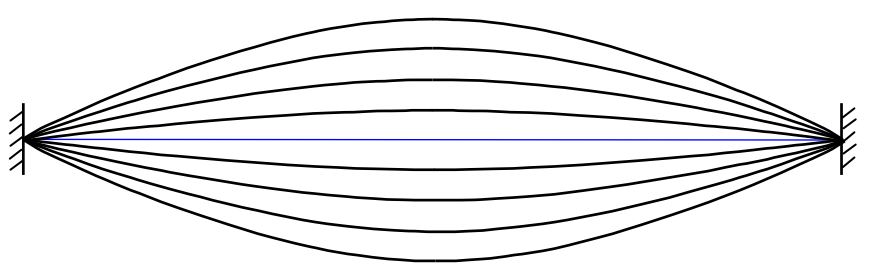
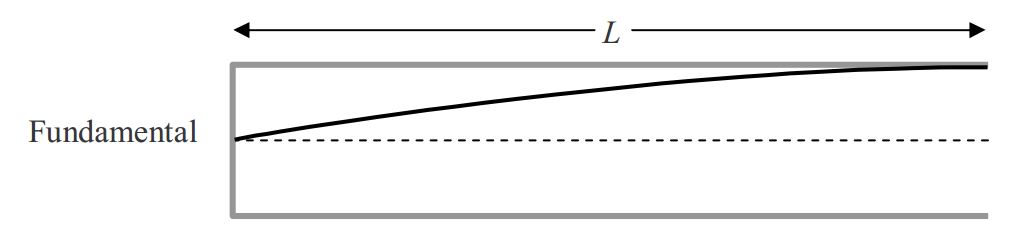
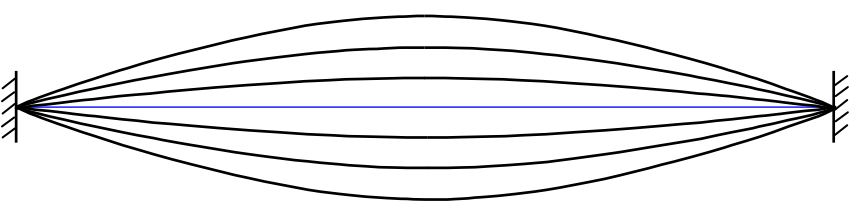
The \(\lambda = 2L\) wave is not the only wave that will fit in the string. It is, however, the longest wavelength standing wave possible and hence is referred to as the fundamental. There is an entire sequence of standing waves. They are named: the fundamental, the first overtone, the second overtone, the third overtone, etc, in order of decreasing wavelength, and hence, increasing frequency.
Each successive waveform can be obtained from the preceding one by including one more node.
A wave in the series is said to be a harmonic if its frequency can be expressed as an integer times the fundamental frequency. The value of the integer determines which harmonic (1st, 2nd, 3rd, etc.) the wave is. The frequency of the fundamental wave is, of course, 1 times itself. The number 1 is an integer so the fundamental is a harmonic. It is the 1st harmonic.
Starting with the wavelengths in the series of diagrams above, we have, for the frequencies, using \(v =\lambda f\) which can be rearranged to read
\[f=\frac{v}{\lambda} \nonumber \]
The Fundamental
\[\lambda_{\tiny\mbox{FUND}}=2L \nonumber \]
\[f_{\tiny\mbox{FUND}}=\frac{v}{\lambda_{\tiny\mbox{FUND}}} \nonumber \]
\[f_{\tiny\mbox{FUND}}=\frac{v}{2L} \nonumber \]
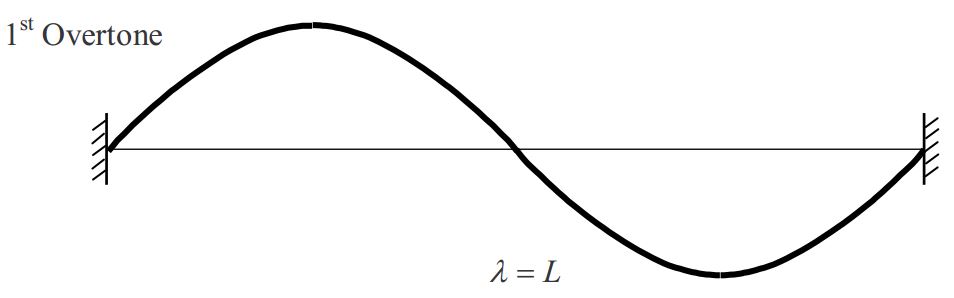
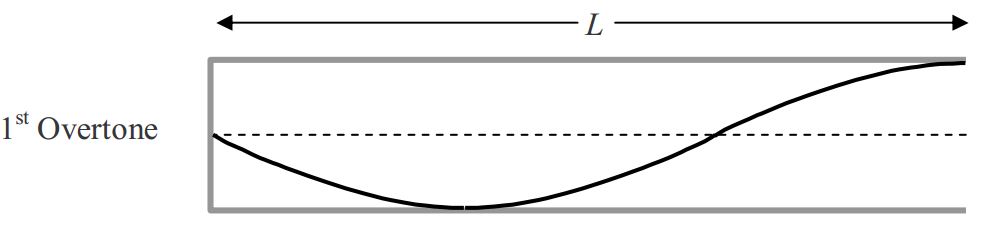
The 1st Overtone
\[\lambda_{\tiny \mbox{1st O.T.}}=L \nonumber \]
\[f_{\tiny \mbox{1st O.T.}}=\frac{v}{\lambda_{\tiny \mbox{1st O.T.}}} \nonumber \]
\[f_{\tiny \mbox{1st O.T.}}=\frac{v}{L} \nonumber \]
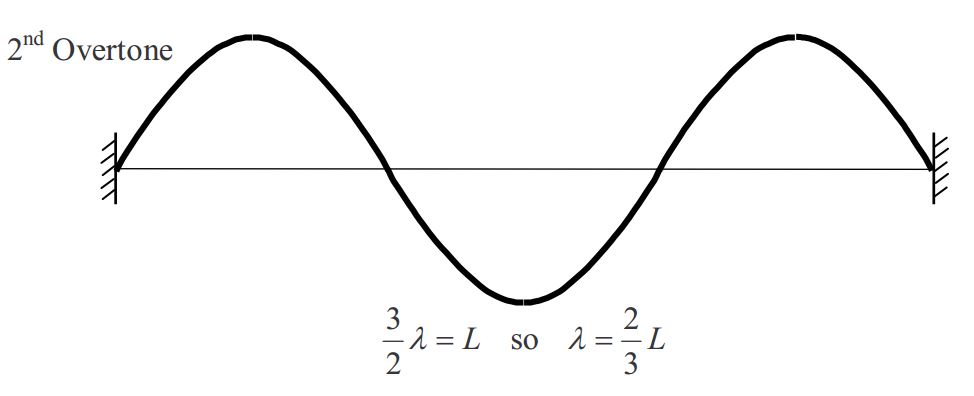
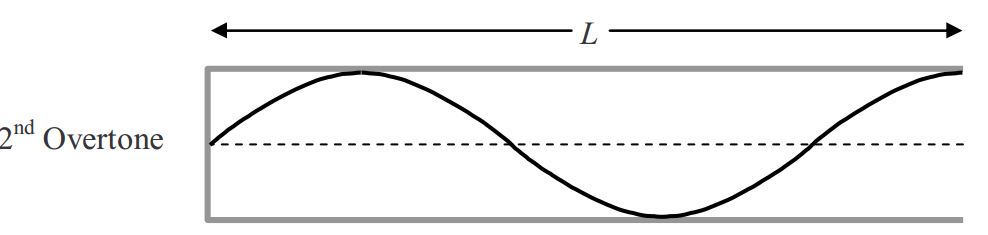
The 2nd Overtone
\[\lambda_{\tiny \mbox{2nd O.T.}}=\frac{2}{3}L \nonumber \]
\[f_{\tiny \mbox{2nd O.T.}}=\frac{v}{\lambda_{\tiny \mbox{2nd O.T.}}} \nonumber \]
\[f_{\tiny \mbox{2nd O.T.}}=\frac{v}{\frac{2}{3}L} \nonumber \]
\[f_{\tiny \mbox{2nd O.T.}}=\frac{3}{2} \, \frac{v}{L} \nonumber \]
Expressing the frequencies in terms of the fundamental frequency \(f_{\tiny \mbox{FUND}}=\frac{v}{2L}\) we have
\[ f_{\tiny \mbox{FUND}} = \frac{v}{2L} =1\Big ( \frac{v}{2L}\Big ) = 1 f_{\tiny \mbox{FUND}} \nonumber \]
\[f_{\tiny \mbox{1st O.T.}}=\frac{v}{L} = 2 \Big ( \frac{v}{2L} \Big) = 2 f_{\tiny \mbox{FUND}} \nonumber \]
\[f_{\tiny \mbox{2nd O.T.}}=\frac{3}{2} \frac{v}{L} = 3 \Big ( \frac{v}{2L} \Big) = 3 f_{\tiny \mbox{FUND}} \nonumber \]
Note that the fundamental is (as always) the 1st harmonic; the 1st overtone is the 2nd harmonic; and the 2nd overtone is the 3rd harmonic. While it is true for the case of a string that is fixed at both ends (the system we have been analyzing), it is not always true that the set of all overtones plus fundamental includes all the harmonics. For instance, consider the following example:
An organ pipe of length \(L\) is closed at one end and open at the other. Given that the speed of sound in air is vs , find the frequencies of the fundamental and the first three overtones.
Solution
\[\frac{1}{4} \lambda=L \quad \mbox{so} \quad \lambda=4L \nonumber \]
\[\frac{3}{4} \lambda=L \quad \mbox{so} \quad \lambda=\frac{4}{3} L \nonumber \]
\[\frac{5}{4} \lambda=L \quad \mbox{so} \quad \lambda=\frac{4}{5} L \nonumber \]
\[\frac{7}{4} \lambda=L \quad \mbox{so} \quad \lambda=\frac{4}{7} L \nonumber \]
In the preceding sequence of diagrams, a graph of displacement vs. position along the pipe, for an instant in time when the air molecules at an antinode are at their maximum displacement from equilibrium, is a more abstract representation then the corresponding graph for a string. The sound wave in air is a longitudinal wave, so, as the sound waves travel back and forth along the length of the pipe, the air molecules oscillate back and forth (rather than up and down as in the case of the string) about their equilibrium positions. Thus, how high up on the graph a point on the graph is, corresponds to how far to the right (using the viewpoint from which the pipe is depicted in the diagrams) of its equilibrium position the thin layer of air molecules, at the corresponding position in the pipe, is. It is conventional to draw the waveform right inside the outline of the pipe. The boundary conditions are that a closed end is a node and an open end is an antinode.
Starting with the wavelengths in the series of diagrams above, we have, for the frequencies, using \(v_s = \lambda f\) which can be rearranged to read
\[f=\frac{v_s}{\lambda} \nonumber \]
The Fundamental
\[\lambda_{\tiny \mbox{FUND}}=4L \nonumber \]
\[f_{\tiny \mbox{FUND}}=\frac{v_s}{\lambda_{\tiny \mbox{FUND}}} \nonumber \]
\[f_{\tiny \mbox{FUND}}=\frac{v_s}{4L} \nonumber \]
The 1st Overtone
\[\lambda_{\tiny\mbox{1st O.T.}}=\frac{4}{3} L \nonumber \]
\[f_{\tiny\mbox{1st O.T.}}=\frac{v_s}{\lambda_{\tiny \mbox{1st O.T.}}} \nonumber \]
\[f_{\tiny\mbox{1st O.T.}}=\frac{v_s}{\frac{4}{3} L} \nonumber \]
\[f_{\tiny\mbox{1st O.T.}}=\frac{3}{4} \frac{v_s}{L} \nonumber \]
The 2nd Overtone
\[\lambda_{\tiny\mbox{2nd O.T.}}=\frac{4}{5} L \nonumber \]
\[f_{\tiny\mbox{2nd O.T.}}=\frac{v_s}{\lambda_{\tiny \mbox{2nd O.T.}}} \nonumber \]
\[f_{\tiny\mbox{2nd O.T.}}=\frac{v_s}{\frac{4}{5} L} \nonumber \]
\[f_{\tiny\mbox{2nd O.T.}}=\frac{5}{4} \frac{v_s}{L} \nonumber \]
The 3rd Overtone
\[\lambda_{\tiny\mbox{3rd O.T.}}=\frac{4}{7} L \nonumber \]
\[f_{\tiny\mbox{3rd O.T.}}=\frac{v_s}{\lambda_{\tiny \mbox{3rd O.T.}}} \nonumber \]
\[f_{\tiny\mbox{3rd O.T.}}=\frac{v_s}{\frac{4}{7} L} \nonumber \]
\[f_{\tiny\mbox{3rd O.T.}}=\frac{7}{4} \frac{v_s}{L} \nonumber \]
Expressing the frequencies in terms of the fundamental frequency \(f_{\tiny\mbox{FUND}}=\frac{v_s}{4L}\) we have
\[f_{\tiny\mbox{FUND}}=\frac{v_s}{4L}=1\Big( \frac{v_s}{4L} \Big)=1f_{\tiny\mbox{FUND}} \nonumber \]
\[f_{\tiny\mbox{1st O.T.}}=\frac{3}{4} \frac{v_s}{4L}=3\Big( \frac{v_s}{4L} \Big)=3f_{\tiny\mbox{FUND}} \nonumber \]
\[f_{\tiny\mbox{2nd O.T.}}=\frac{5}{4} \frac{v_s}{4L}=5\Big( \frac{v_s}{4L} \Big)=5f_{\tiny\mbox{FUND}} \nonumber \]
\[f_{\tiny\mbox{3rd O.T.}}=\frac{7}{4} \frac{v_s}{4L}=7\Big( \frac{v_s}{4L} \Big)=7f_{\tiny\mbox{FUND}} \nonumber \]
Note that the frequencies of the standing waves are odd integer multiples of the fundamental frequency. That is to say that only odd harmonics, the 1st, 3rd, 5th, etc. occur in the case of a pipe closed at one end and open at the other.
Regarding, Waves, in a Medium that is in Contact with a 2nd Medium
Consider a violin string oscillating at its fundamental frequency, in air. For convenience of discussion, assume the violin to be oriented so that the oscillations are up and down.
Each time the string goes up it pushes air molecules up. This results in sound waves in air. The violin with the standing wave in it can be considered to be the “something oscillating” that is the cause of the waves in air. Recall that the frequency of the waves is identical to the frequency of the source. Thus, the frequency of the sound waves in air will be identical to the frequency of the waves in the string. In general, the speed of the waves in air is different from the speed of waves in the string. From \(v = \lambda f\), this means that the wavelengths will be different as well.