
4.1.1: Transverse Waves
- Page ID
- 26155

\( \newcommand{\vecs}[1]{\overset { \scriptstyle \rightharpoonup} {\mathbf{#1}} } \)
\( \newcommand{\vecd}[1]{\overset{-\!-\!\rightharpoonup}{\vphantom{a}\smash {#1}}} \)
\( \newcommand{\id}{\mathrm{id}}\) \( \newcommand{\Span}{\mathrm{span}}\)
( \newcommand{\kernel}{\mathrm{null}\,}\) \( \newcommand{\range}{\mathrm{range}\,}\)
\( \newcommand{\RealPart}{\mathrm{Re}}\) \( \newcommand{\ImaginaryPart}{\mathrm{Im}}\)
\( \newcommand{\Argument}{\mathrm{Arg}}\) \( \newcommand{\norm}[1]{\| #1 \|}\)
\( \newcommand{\inner}[2]{\langle #1, #2 \rangle}\)
\( \newcommand{\Span}{\mathrm{span}}\)
\( \newcommand{\id}{\mathrm{id}}\)
\( \newcommand{\Span}{\mathrm{span}}\)
\( \newcommand{\kernel}{\mathrm{null}\,}\)
\( \newcommand{\range}{\mathrm{range}\,}\)
\( \newcommand{\RealPart}{\mathrm{Re}}\)
\( \newcommand{\ImaginaryPart}{\mathrm{Im}}\)
\( \newcommand{\Argument}{\mathrm{Arg}}\)
\( \newcommand{\norm}[1]{\| #1 \|}\)
\( \newcommand{\inner}[2]{\langle #1, #2 \rangle}\)
\( \newcommand{\Span}{\mathrm{span}}\) \( \newcommand{\AA}{\unicode[.8,0]{x212B}}\)
\( \newcommand{\vectorA}[1]{\vec{#1}} % arrow\)
\( \newcommand{\vectorAt}[1]{\vec{\text{#1}}} % arrow\)
\( \newcommand{\vectorB}[1]{\overset { \scriptstyle \rightharpoonup} {\mathbf{#1}} } \)
\( \newcommand{\vectorC}[1]{\textbf{#1}} \)
\( \newcommand{\vectorD}[1]{\overrightarrow{#1}} \)
\( \newcommand{\vectorDt}[1]{\overrightarrow{\text{#1}}} \)
\( \newcommand{\vectE}[1]{\overset{-\!-\!\rightharpoonup}{\vphantom{a}\smash{\mathbf {#1}}}} \)
\( \newcommand{\vecs}[1]{\overset { \scriptstyle \rightharpoonup} {\mathbf{#1}} } \)
\( \newcommand{\vecd}[1]{\overset{-\!-\!\rightharpoonup}{\vphantom{a}\smash {#1}}} \)
\(\newcommand{\avec}{\mathbf a}\) \(\newcommand{\bvec}{\mathbf b}\) \(\newcommand{\cvec}{\mathbf c}\) \(\newcommand{\dvec}{\mathbf d}\) \(\newcommand{\dtil}{\widetilde{\mathbf d}}\) \(\newcommand{\evec}{\mathbf e}\) \(\newcommand{\fvec}{\mathbf f}\) \(\newcommand{\nvec}{\mathbf n}\) \(\newcommand{\pvec}{\mathbf p}\) \(\newcommand{\qvec}{\mathbf q}\) \(\newcommand{\svec}{\mathbf s}\) \(\newcommand{\tvec}{\mathbf t}\) \(\newcommand{\uvec}{\mathbf u}\) \(\newcommand{\vvec}{\mathbf v}\) \(\newcommand{\wvec}{\mathbf w}\) \(\newcommand{\xvec}{\mathbf x}\) \(\newcommand{\yvec}{\mathbf y}\) \(\newcommand{\zvec}{\mathbf z}\) \(\newcommand{\rvec}{\mathbf r}\) \(\newcommand{\mvec}{\mathbf m}\) \(\newcommand{\zerovec}{\mathbf 0}\) \(\newcommand{\onevec}{\mathbf 1}\) \(\newcommand{\real}{\mathbb R}\) \(\newcommand{\twovec}[2]{\left[\begin{array}{r}#1 \\ #2 \end{array}\right]}\) \(\newcommand{\ctwovec}[2]{\left[\begin{array}{c}#1 \\ #2 \end{array}\right]}\) \(\newcommand{\threevec}[3]{\left[\begin{array}{r}#1 \\ #2 \\ #3 \end{array}\right]}\) \(\newcommand{\cthreevec}[3]{\left[\begin{array}{c}#1 \\ #2 \\ #3 \end{array}\right]}\) \(\newcommand{\fourvec}[4]{\left[\begin{array}{r}#1 \\ #2 \\ #3 \\ #4 \end{array}\right]}\) \(\newcommand{\cfourvec}[4]{\left[\begin{array}{c}#1 \\ #2 \\ #3 \\ #4 \end{array}\right]}\) \(\newcommand{\fivevec}[5]{\left[\begin{array}{r}#1 \\ #2 \\ #3 \\ #4 \\ #5 \\ \end{array}\right]}\) \(\newcommand{\cfivevec}[5]{\left[\begin{array}{c}#1 \\ #2 \\ #3 \\ #4 \\ #5 \\ \end{array}\right]}\) \(\newcommand{\mattwo}[4]{\left[\begin{array}{rr}#1 \amp #2 \\ #3 \amp #4 \\ \end{array}\right]}\) \(\newcommand{\laspan}[1]{\text{Span}\{#1\}}\) \(\newcommand{\bcal}{\cal B}\) \(\newcommand{\ccal}{\cal C}\) \(\newcommand{\scal}{\cal S}\) \(\newcommand{\wcal}{\cal W}\) \(\newcommand{\ecal}{\cal E}\) \(\newcommand{\coords}[2]{\left\{#1\right\}_{#2}}\) \(\newcommand{\gray}[1]{\color{gray}{#1}}\) \(\newcommand{\lgray}[1]{\color{lightgray}{#1}}\) \(\newcommand{\rank}{\operatorname{rank}}\) \(\newcommand{\row}{\text{Row}}\) \(\newcommand{\col}{\text{Col}}\) \(\renewcommand{\row}{\text{Row}}\) \(\newcommand{\nul}{\text{Nul}}\) \(\newcommand{\var}{\text{Var}}\) \(\newcommand{\corr}{\text{corr}}\) \(\newcommand{\len}[1]{\left|#1\right|}\) \(\newcommand{\bbar}{\overline{\bvec}}\) \(\newcommand{\bhat}{\widehat{\bvec}}\) \(\newcommand{\bperp}{\bvec^\perp}\) \(\newcommand{\xhat}{\widehat{\xvec}}\) \(\newcommand{\vhat}{\widehat{\vvec}}\) \(\newcommand{\uhat}{\widehat{\uvec}}\) \(\newcommand{\what}{\widehat{\wvec}}\) \(\newcommand{\Sighat}{\widehat{\Sigma}}\) \(\newcommand{\lt}{<}\) \(\newcommand{\gt}{>}\) \(\newcommand{\amp}{&}\) \(\definecolor{fillinmathshade}{gray}{0.9}\)Waves move over time which makes it hard to draw on a piece of paper. There are two possible representations. Suppose there is a cork floating in the water that is fixed at a certain location and we record the displacement (how high and low it is from equilibrium) at different times. If we plot the displacement versus time we have a frozen position graph:
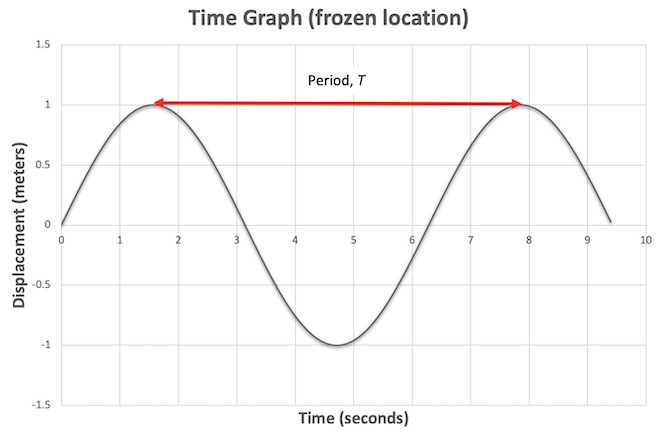
Figure \(\PageIndex{1}\)
The displacement from the equilibrium position will be measured in meters but the horizontal peak to peak distance is a time measurement. This graph looks just like the graph for simple harmonic motion from Chapter 3. In fact the cork is undergoing simple harmonic motion and the horizontal peak to peak distance in the is the period, \(T\) of the wave (just like the peak to peak distance of a time graph of harmonic motion was the period). According to the graph the first peak is at \(1.5\text{ s}\) when the second is at \(7.8\text{ s}\) so the period is \(7.8\text{ s} - 1.5\text{ s} = 6.3\text{ s}\). As in the last two chapters, the wave frequency is given by \(f=1/T\) in Hertz so this oscillation has a frequency of \(1/6.3\text{ s} = 0.16\text{ Hz}\).
We can make a second kind of graph of the wave if we take a snapshot (frozen time) of the wave and then plot the height (amplitude) versus position. This gives us the following picture of a wave frozen in time (much like a photo of a wave):

Figure \(\PageIndex{2}\)
The displacement from the equilibrium position will be measured in meters (or centimeters, etc.) just like in the previous graph. We can also measure the horizontal distance from one peak to the next but this time it will be in meters instead of seconds. This distance is called the wavelength ,\(\lambda\). In the graph the peak to peak distance is from \(2.5\text{ m}\) to \(4.6\text{ m}\) which gives a wavelength of \(4.6\text{ m} - 2.5\text{ m} = 2.1\text{ m}\) (this is also the bottom to bottom distance or distance from where it is increasing and has a displacement of zero to the next place where it is increasing and has a displacement of zero, etc.).
Now imagine a long line of corks floating on the surface of a lake. As a wave passes by, the closer end of the row of corks starts moving up and down and then the rest of the row. Each cork is undergoing simple harmonic motion (which we studied in Chapter 3) but at a slightly different phase. Each cork has a time graph like the first graph above but taking a picture of the group as a whole gives a frozen time graph like the second graph above. The equations describing a wave will be sine and cosine functions, just as for the simple harmonic motion we saw in Chapter 3 but now the variables will depend on both time and distance (the simulation exercise below explains this in detail).
The speed of the wave, its frequency and its wavelength are related. If two waves are traveling at the same speed but have different wavelengths, a cork floating on each will bob up and down at different rates and so have different frequencies. A shorter wavelength will make the cork bob more often while a longer wavelength will make the cork bob less often. Mathematically this relationship is expressed as \(v=\lambda f\) where \(v\) is the speed of the wave in meters per second, \(\lambda \) is the wavelength in meters and \(f\) is the frequency of the wave in Hertz. This equation applies to all types of waves and we will use it many more times in this book.
Video/audio examples:
- Lecture from Kahn Academy on amplitude, frequency, wavelength, 15 min.
- Transverse and longitudinal wave lecture.
- Transverse and longitudinal wave lecture.