

5.4: Dark Matter
- Page ID
- 164202

\( \newcommand{\vecs}[1]{\overset { \scriptstyle \rightharpoonup} {\mathbf{#1}} } \)
\( \newcommand{\vecd}[1]{\overset{-\!-\!\rightharpoonup}{\vphantom{a}\smash {#1}}} \)
\( \newcommand{\dsum}{\displaystyle\sum\limits} \)
\( \newcommand{\dint}{\displaystyle\int\limits} \)
\( \newcommand{\dlim}{\displaystyle\lim\limits} \)
\( \newcommand{\id}{\mathrm{id}}\) \( \newcommand{\Span}{\mathrm{span}}\)
( \newcommand{\kernel}{\mathrm{null}\,}\) \( \newcommand{\range}{\mathrm{range}\,}\)
\( \newcommand{\RealPart}{\mathrm{Re}}\) \( \newcommand{\ImaginaryPart}{\mathrm{Im}}\)
\( \newcommand{\Argument}{\mathrm{Arg}}\) \( \newcommand{\norm}[1]{\| #1 \|}\)
\( \newcommand{\inner}[2]{\langle #1, #2 \rangle}\)
\( \newcommand{\Span}{\mathrm{span}}\)
\( \newcommand{\id}{\mathrm{id}}\)
\( \newcommand{\Span}{\mathrm{span}}\)
\( \newcommand{\kernel}{\mathrm{null}\,}\)
\( \newcommand{\range}{\mathrm{range}\,}\)
\( \newcommand{\RealPart}{\mathrm{Re}}\)
\( \newcommand{\ImaginaryPart}{\mathrm{Im}}\)
\( \newcommand{\Argument}{\mathrm{Arg}}\)
\( \newcommand{\norm}[1]{\| #1 \|}\)
\( \newcommand{\inner}[2]{\langle #1, #2 \rangle}\)
\( \newcommand{\Span}{\mathrm{span}}\) \( \newcommand{\AA}{\unicode[.8,0]{x212B}}\)
\( \newcommand{\vectorA}[1]{\vec{#1}} % arrow\)
\( \newcommand{\vectorAt}[1]{\vec{\text{#1}}} % arrow\)
\( \newcommand{\vectorB}[1]{\overset { \scriptstyle \rightharpoonup} {\mathbf{#1}} } \)
\( \newcommand{\vectorC}[1]{\textbf{#1}} \)
\( \newcommand{\vectorD}[1]{\overrightarrow{#1}} \)
\( \newcommand{\vectorDt}[1]{\overrightarrow{\text{#1}}} \)
\( \newcommand{\vectE}[1]{\overset{-\!-\!\rightharpoonup}{\vphantom{a}\smash{\mathbf {#1}}}} \)
\( \newcommand{\vecs}[1]{\overset { \scriptstyle \rightharpoonup} {\mathbf{#1}} } \)
\(\newcommand{\longvect}{\overrightarrow}\)
\( \newcommand{\vecd}[1]{\overset{-\!-\!\rightharpoonup}{\vphantom{a}\smash {#1}}} \)
\(\newcommand{\ket}[1]{\left| #1 \right>}\)
\(\newcommand{\bra}[1]{\left< #1 \right|}\)
\(\newcommand{\braket}[2]{\left< #1 \vphantom{#2} \right| \left. #2 \vphantom{#1} \right>}\)
\(\newcommand{\braopket}[3]{\left< #1 \vphantom{#2}\vphantom{#3} \right| #2 \vphantom{#1}\vphantom{#3} \left| #3 \vphantom{#1}\vphantom{#2} \right>}\)
\(\newcommand{\qmvec}[1]{\mathbf{\vec{#1}}}\)
\(\newcommand{\op}[1]{\hat{\mathbf{#1}}}\)
\(\newcommand{\expect}[1]{\langle #1 \rangle}\)
\(\newcommand{\dfn}[1]{\emph{\textbf{#1}}}\)
A rotation curve is a graph of how fast things orbit at different distances from the center of a system. In this activity you will predict the rotation curve of a galaxy, compare your prediction with real measurements, and figure out what is missing.
How to draw each graph: Every graph in this activity starts blank. First sketch the curve from the previous graph in pencil. Then use a colored pencil to draw only the parts that change. You do not need numbers. Just show where the speed is higher or lower.
What Sets an Orbital Speed?
 Model
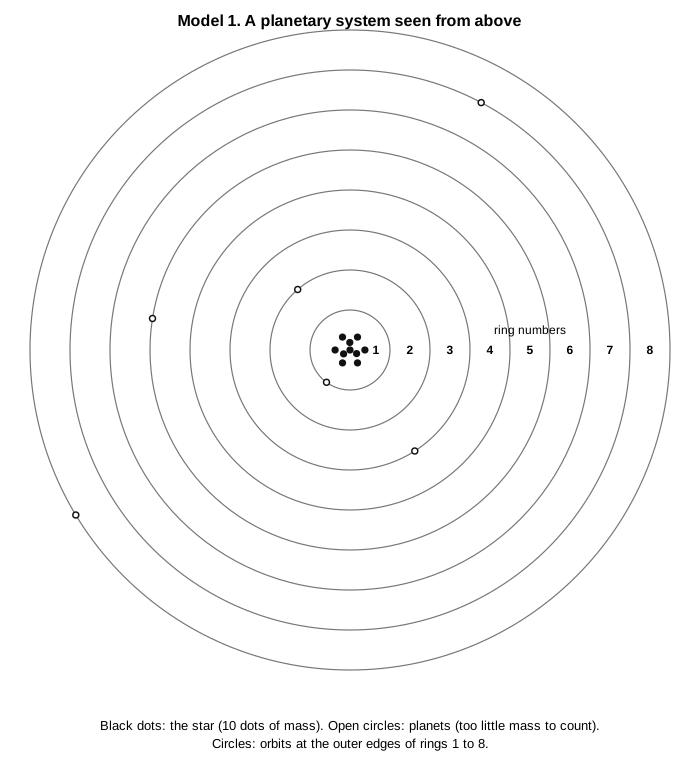
Model 1: A planetary system. Almost all of the mass is in the star at the center. Each black dot stands for the same amount of mass.
| Planet | Mercury | Venus | Earth | Mars | Jupiter | Saturn | Uranus | Neptune |
|---|---|---|---|---|---|---|---|---|
| Orbital speed (km/s) | 47 | 35 | 30 | 24 | 13 | 10 | 7 | 5 |
 Explore
- The planets in the table are listed from closest to the Sun to farthest. How does orbital speed change as distance from the Sun increases?
- Count the dots in Model 1. Count the star's dots as part of ring 1. In the second row, write how many dots are inside an orbit at the outer edge of each ring.
Ring 1 Ring 2 Ring 3 Ring 4 Ring 5 Ring 6 Ring 7 Ring 8 Dots in this ring Dots inside the orbit -
Graph 1. Sketch the rotation curve for Model 1 in pencil: the orbital speed at the outer edge of each ring.
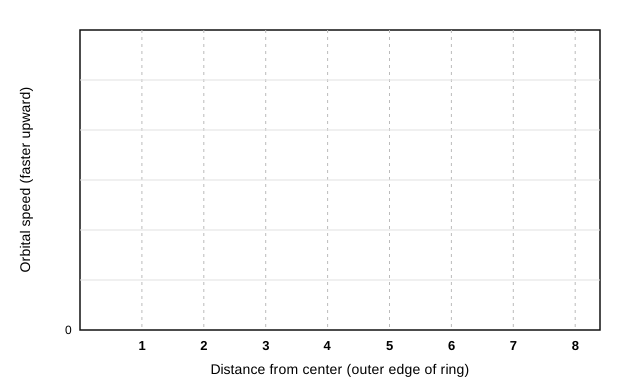
Graph 1. Model 1. - Every planet in Model 1 has the same mass inside its orbit. So why do the farther planets move more slowly?
 Critical thinking & Concept Invention
Model 2: Extra mass in a shell. Suppose some extra mass is spread evenly in a thin, hollow shell around the star. Seen from above, the shell looks like a ring. The planet's orbit stays the same size.


- In Model 2A, the shell and the star both pull the planet toward the center. Compared with having no shell, should the planet move faster or slower to stay in the same orbit? Explain using question 4.
- In Model 2B, the planet is inside the shell. The near side of the shell is close but is only a small part of the shell. The far side is far away but is a much larger part. Do the pulls from the near side and the far side add up, or do they cancel? Explain.
- So does the shell in Model 2B change the planet's orbital speed?
- Write a rule in your own words: which mass affects a planet's orbital speed, and which mass does not?
 Summary
The rule for this activity
- The orbital speed at any distance depends only on the mass inside that orbit.
- More mass inside means a faster orbit.
- The same mass inside, but farther away, means a slower orbit.
- Mass outside the orbit does not change the speed.
- Use the rule. Which of these changes would change Earth's orbital speed? For each one, write faster, slower, or no change.
Change Earth's speed (a) A shell of dust appears outside Earth's orbit. (b) A shell of dust appears between Venus's orbit and Earth's orbit. (c) The Sun's mass doubles.
 Apply
- The asteroid belt is a wide band of rocks between the orbits of Mars and Jupiter. Does its mass affect Mars's orbital speed? Does it affect Jupiter's? (The asteroids have very little mass, so any effect is tiny.)
Adding Mass in a Ring
Model
Model 3: Extra mass in ring 4. This is the same star as in Model 1, plus 10 more dots of mass spread around ring 4.

Explore
- Fill in the counts for Model 3.
Ring 1 Ring 2 Ring 3 Ring 4 Ring 5 Ring 6 Ring 7 Ring 8 Dots in this ring Dots inside the orbit - Compare with your table from question 2. For which rings is the mass inside the orbit the same as in Model 1? For which rings is it different?
-
Graph 2. Sketch your Graph 1 curve in pencil. Then use a colored pencil to show how the curve changes for Model 3.
Graph 2. Model 3.
Critical thinking & Concept Invention
- Why does the curve jump at ring 4, instead of rising gradually starting at ring 1?
- Suppose the 10 extra dots were spread out instead: 2 dots in each of rings 4, 5, 6, 7, and 8. Describe how the curve past ring 3 would be different from Graph 2.
Summary
- Complete the sentences. Adding mass in one ring changes the speed of orbits that ring, but not orbits it. Spreading mass farther out makes the speed .
Apply
Model 4: A spiral galaxy. In a galaxy, the mass is not all in the center. Astronomers can see where the stars and gas are from their light. Model 4 shows where they are in a typical spiral galaxy.

- Fill in the counts for Model 4.
Ring 1 Ring 2 Ring 3 Ring 4 Ring 5 Ring 6 Ring 7 Ring 8 Dots in this ring Dots inside the orbit -
Graph 3. Sketch your Graph 2 curve in pencil for comparison. Then use a colored pencil to draw the rotation curve you predict for Model 4. Hint: near the center, the mass inside grows quickly from ring to ring. Far out, it hardly grows at all.
Graph 3. Your prediction for Model 4.
A Real Galaxy
Model
Model 5: Galaxy M33. M33, the Triangulum Galaxy, is a nearby spiral galaxy about 3 million light-years away. The photo shows its inner part. Its hydrogen gas reaches much farther out than its stars. Astronomers measure how fast the gas orbits by using the Doppler shift of radio waves from hydrogen.


Explore
- Look at the top graph. Where does most of M33's starlight come from? About how far out does the starlight mostly end?
- Look at the bottom graph. Describe the measured speed close to the center and far from the center.
-
Graph 4. Sketch your Model 4 prediction (Graph 3) in pencil. Then use a colored pencil to sketch the shape of M33's real curve. Line it up so that the place where M33's starlight ends is at ring 7. Where do the two curves agree, and where do they disagree?
Graph 4. Your prediction and M33's real curve.
Critical thinking & Concept Invention
- Use the rule. Far from M33's center, the distance keeps growing but the speed does not fall. What must be true about the mass inside the orbit as you go farther out?
- Go back to Model 4. Using a colored pencil, add dots to the rings wherever they are needed so that the curve stays flat all the way to ring 8 instead of falling. Then fill in the table.
Ring 1 Ring 2 Ring 3 Ring 4 Ring 5 Ring 6 Ring 7 Ring 8 Dots of stars and gas (Model 4) Dots you added New total inside the orbit -
Graph 5. Sketch your Model 4 prediction (Graph 3) in pencil. Then use a colored pencil to draw the curve with your added dots.
Graph 5. Model 4 with your added dots. - Describe the pattern of the dots you added. Where are they, and how many are in each outer ring?
- Do the dots you added give off light? Use Model 5 to explain how you know.
Summary
The dots you added stand for mass that pulls on stars and gas with gravity but gives off no light that we can detect. Astronomers call it dark matter. Rotation curves like M33's are some of the strongest evidence for dark matter.
- Complete the sentences. Dark matter is spread in a huge, roughly round cloud called a halo that reaches far beyond . We cannot see it, but we can detect it by its , which makes stars and gas orbit .
- How many dots did you add, compared with the 29 dots of stars and gas? What does this suggest about how much of a galaxy is dark matter?
Apply
Model 6: Our galaxy. Astronomers have measured how fast stars orbit the center of the Milky Way at many distances. Most of the Milky Way's starlight comes from within about 50,000 light-years of its center.
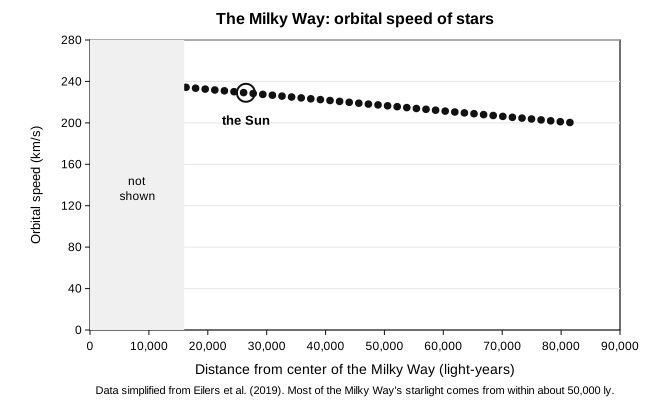
- Is the Milky Way's rotation curve more like the planetary system (Graph 1) or like M33? Explain.
- The speeds stay near 200 km/s even beyond 50,000 light-years, where there is little starlight. What does this tell you about the Milky Way?
- The Sun orbits at about 230 km/s. If the Milky Way had no dark matter, would the Sun orbit faster or slower? Use the rule to explain.
Image and data credits
- M33 photo: NASA, ESA, and M. Durbin, J. Dalcanton, and B. F. Williams (University of Washington). Source
- M33 rotation curve and starlight: simplified from E. Corbelli et al., "Dynamical signatures of a ΛCDM-halo and the distribution of the baryons in M33," Astronomy & Astrophysics 572, A23 (2014). Source
- Milky Way rotation curve: simplified from A.-C. Eilers et al., "The Circular Velocity Curve of the Milky Way from 5 to 25 kpc," The Astrophysical Journal 871, 120 (2019). Source
- Planet speeds: NASA planetary fact sheets, rounded.
- All diagrams are original to this workbook.