
10.6: Elasticity and Plasticity


- Last updated
- Jun 17, 2019
- Save as PDF

( \newcommand{\kernel}{\mathrm{null}\,}\)
- Explain the limit where a deformation of material is elastic
- Describe the range where materials show plastic behavior
- Analyze elasticity and plasticity on a stress-strain diagram
We referred to the proportionality constant between stress and strain as the elastic modulus. But why do we call it that? What does it mean for an object to be elastic and how do we describe its behavior?
Elasticity is the tendency of solid objects and materials to return to their original shape after the external forces (load) causing a deformation are removed. An object is elastic when it comes back to its original size and shape when the load is no longer present. Physical reasons for elastic behavior vary among materials and depend on the microscopic structure of the material. For example, the elasticity of polymers and rubbers is caused by stretching polymer chains under an applied force. In contrast, the elasticity of metals is caused by resizing and reshaping the crystalline cells of the lattices (which are the material structures of metals) under the action of externally applied forces.
The two parameters that determine the elasticity of a material are its elastic modulus and its elastic limit. A high elastic modulus is typical for materials that are hard to deform; in other words, materials that require a high load to achieve a significant strain. An example is a steel band. A low elastic modulus is typical for materials that are easily deformed under a load; for example, a rubber band. If the stress under a load becomes too high, then when the load is removed, the material no longer comes back to its original shape and size, but relaxes to a different shape and size: The material becomes permanently deformed. The elastic limit is the stress value beyond which the material no longer behaves elastically but becomes permanently deformed.
Our perception of an elastic material depends on both its elastic limit and its elastic modulus. For example, all rubbers are characterized by a low elastic modulus and a high elastic limit; hence, it is easy to stretch them and the stretch is noticeably large. Among materials with identical elastic limits, the most elastic is the one with the lowest elastic modulus.
When the load increases from zero, the resulting stress is in direct proportion to strain in the way given by Equation 12.4.4, but only when stress does not exceed some limiting value. For stress values within this linear limit, we can describe elastic behavior in analogy with Hooke’s law for a spring. According to Hooke’s law, the stretch value of a spring under an applied force is directly proportional to the magnitude of the force. Conversely, the response force from the spring to an applied stretch is directly proportional to the stretch. In the same way, the deformation of a material under a load is directly proportional to the load, and, conversely, the resulting stress is directly proportional to strain. The linearity limit (or the proportionality limit) is the largest stress value beyond which stress is no longer proportional to strain. Beyond the linearity limit, the relation between stress and strain is no longer linear. When stress becomes larger than the linearity limit but still within the elasticity limit, behavior is still elastic, but the relation between stress and strain becomes nonlinear.
For stresses beyond the elastic limit, a material exhibits plastic behavior. This means the material deforms irreversibly and does not return to its original shape and size, even when the load is removed. When stress is gradually increased beyond the elastic limit, the material undergoes plastic deformation. Rubber-like materials show an increase in stress with the increasing strain, which means they become more difficult to stretch and, eventually, they reach a fracture point where they break. Ductile materials such as metals show a gradual decrease in stress with the increasing strain, which means they become easier to deform as stress-strain values approach the breaking point. Microscopic mechanisms responsible for plasticity of materials are different for different materials.
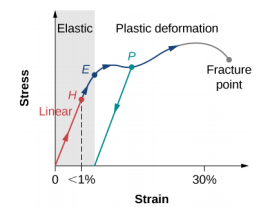
We can graph the relationship between stress and strain on a stress-strain diagram. Each material has its own characteristic strain-stress curve. A typical stress-strain diagram for a ductile metal under a load is shown in Figure 10.6.1. In this figure, strain is a fractional elongation (not drawn to scale). When the load is gradually increased, the linear behavior (red line) that starts at the no-load point (the origin) ends at the linearity limit at point H. For further load increases beyond point H, the stress-strain relation is nonlinear but still elastic. In the figure, this nonlinear region is seen between points H and E. Ever larger loads take the stress to the elasticity limit E, where elastic behavior ends and plastic deformation begins. Beyond the elasticity limit, when the load is removed, for example at P, the material relaxes to a new shape and size along the green line. This is to say that the material becomes permanently deformed and does not come back to its initial shape and size when stress becomes zero.
The material undergoes plastic deformation for loads large enough to cause stress to go beyond the elasticity limit at E. The material continues to be plastically deformed until the stress reaches the fracture point (breaking point). Beyond the fracture point, we no longer have one sample of material, so the diagram ends at the fracture point. For the completeness of this qualitative description, it should be said that the linear, elastic, and plasticity limits denote a range of values rather than one sharp point.
The value of stress at the fracture point is called breaking stress (or ultimate stress). Materials with similar elastic properties, such as two metals, may have very different breaking stresses. For example, ultimate stress for aluminum is 2.2 x 10⁸ Pa and for steel it may be as high as 20.0 x 10⁸ Pa, depending on the kind of steel. We can make a quick estimate, based on Equation 12.4.5, that for rods with a 1-in2 cross-sectional area, the breaking load for an aluminum rod is 3.2 x 10⁴ lb, and the breaking load for a steel rod is about nine times larger.