
NMR Spectroscopy vs. X-ray Crystallography
( \newcommand{\kernel}{\mathrm{null}\,}\)
Although they utilize different approaches, nuclear magnetic resonance (NMR) spectroscopy and x-ray crystallography comprise the two best means of analyzing protein structure and function at or near atomic resolution. The degree to which these techniques differ and complement each has been a source of long-standing debate. Do proteins amenable to structural analysis by NMR also crystallize well? Does crystallography provide better structural resolution? Is NMR protein analysis closer to the native state? Despite some similarities and differences, each technique excels where the other falls short, making protein NMR and x-ray crystallography two very complementary spectroscopic methods for high resolution analysis of protein structure and function.
Below is a brief summary of the basic technical aspects of protein NMR spectroscopy as compared to x-ray crystallography. A more thorough analysis for each technique can be found in existing UC Davis Wiki pages for Nuclear Magnetic Resonance (NMR) Spectroscopy and X-ray Crystallography.
Protein NMR Spectroscopy
Nuclear magnetic resonance (NMR) spectroscopy is based on the absorption of electromagnetic radiation in the radio-frequency (RF) range (10 MHz - 1 GHz) by atomic nuclei placed into a strong external magnetic field (B0). The magnetic field partially polarizes the nuclei and the strong RF field excites some of the nuclear spins into their higher energy state. When the strong RF signal is switched off, the spins return to their lower energy state, producing a small amount of radiation (the Larmor frequency) due to "spin relaxation" associated with that field. The radiation emitted induces a radio frequency signal in a detector coil within the NMR spectrometer, which is then amplified and Fourier transformed to produce the NMR signal (the "chemical shift').
The population difference between nuclei in the ground and excited states can be determined by the Boltzman distribution:
NαNβ=eΔE/kT
where
ΔE=γhB02π
In most other spectroscopies, this energy difference is relatively large, such that the ground state is almost completely populated at equilibrium. Splitting between nuclear spin states, however, is very small even at high magnetic field strengths. For example, a 1H NMR signal in a 500 MHz spectrometer (B0 = 11.74T) at 298K gives a Nα/Nβ = 1.000081, which improves to 1.000144 with a 900 MHz (B0 = 21T) spectrometer. Given that the excited state lifetimes are much longer in NMR than other types of spectroscopy, NMR spectroscopy is an inherently insensitive technique that requires a highly concentrated and pure, isotopically labeled sample (1H, 13C, 15N) to obtain a good signal-to-noise ratio. The benefit of NMR, however, is that it can detect the very small population differences in the chemical environment, giving rise to a much higher spectral resolution than can be found using other spectroscopy methods.
Protein X-ray Crystallography
X-ray crystallography is a form of very high-resolution microscopy which enables the atomic-level visualization of protein structures. Like other forms of microscopy and spectroscopy, x-ray crystallography utilizes electromagnetic radiation to analyze the structure of the protein of interest. Unlike these other forms of structure determination, however, it uses very high energy x-rays (λ ~ 0.1 nm). Because atomic electron clouds are on the same scale as the radiation wavelength, the incident radiation is deflected and scattered by electrons surrounding the atoms in the protein crystal. The deflected beams interfere both constructively and destructively to produce a scattering distribution that is proportional to the scattering angle. This process is described by Bragg's law,
nλ=2dsinθ
which states that the angle of diffraction is inversely proportional to the interplanar spacing of the crystal lattice (sinθ is proportional to 1/d). The patterned dots found in the diffraction spacing, therefore, represent the "reciprocal space", as they exhibit a reciprocal relationship to the spacing of atoms within the crystal lattice, which represent "real space". Because the diffraction pattern of a crystal is the Fourier transform of its structure, the pattern is reverse-Fourier transformed to obtain a structure without phase information. Phase information is obtained through either molecular or isomorphous replacement or anomalous dispersion techniques, which is then back-calculated through Fourier transforms into the electron density, giving form to a structural model of the protein.
In much the same way as in NMR spectroscopy, it is impossible to obtain a diffraction pattern from a single protein molecule. This necessitates that a protein sample be highly concentrated and pure in order to create an ordered lattice of identical protein molecules, i.e. a crystal. It is essential that the crystal be well-ordered because the process of obtaining diffraction data involves rotating the crystal in the x-ray beam to cover as many angles as possible; a crystal with a poorly aligned protein lattice will result in a poor diffraction pattern, and ultimately a low resolution structural model.
Data Analysis
One of the major differences between NMR and x-ray crystallography is the extent to which the data is analyzed. Though by no means an easy task, processing of crystallographic data is relatively straight-forward. Given a diffraction pattern, each dot is indexed and the pattern is assigned a space group. This is then further analyzed by Fourier transform, phases are assigned through one of the replacement techniques mentioned above, and an electron density map is generated. After multiple rounds of refinement in which the backbone and side-chain atoms of the protein are fitted into the electron density map, the protein structure can be completed. This structure represents a single instance of the protein in a particular orientation; be it in its apo form or bound to its ligand/cofactor/receptor. A variety of R factors and the overall resolution describe the quality of the structure, whereas B factors reflect the amount of disorder in various regions of the protein due to either thermal motion or potential conformational differences between the unit cells.
In contrast to the single instance of a protein’s structure derived from crystallography, protein structures derived from NMR experiments comprise 20 to 40 or so lowest energy structures. This is because proteins analyzed by NMR are in solution, and have the freedom to move as they potentially would in their natural environment. Because NMR data is collected on a large population of a protein’s many conformations, the most abundant conformations present under particular temperature, buffer, and additive (ligand/cofactor) conditions are compiled to give the lowest energy structures of that protein.
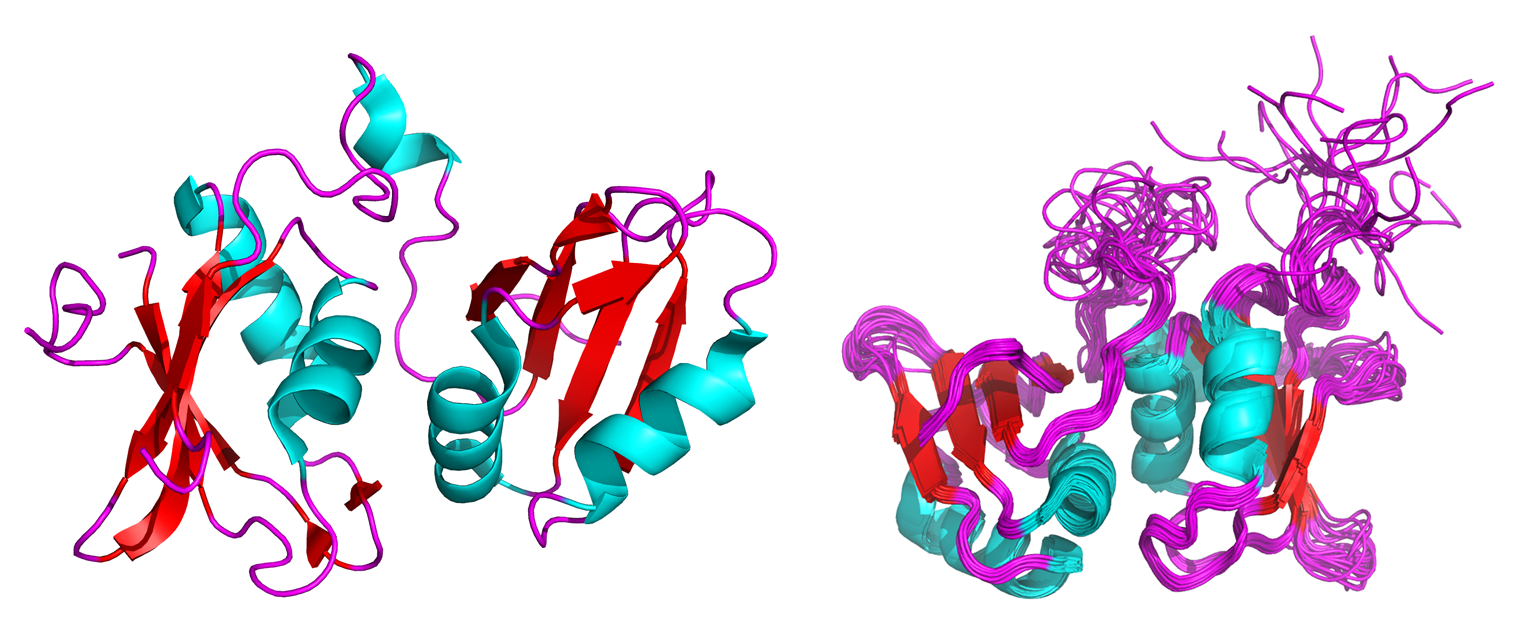
Figure 1: Crystal (left) and NMR solution (right) structures of the neuronal isoform of the polypyrimidine tract binding protein (nPTB)3.
Obtaining these low energy structures involves experiments which correlate the positions of two (2D NMR; typically 1H and 15N) or three (3D NMR; typically 1H, 15N, 13C) types of isotopically labeled backbone and/or sidechain atoms to their nearest neighbors; these are through-bond experiments which assign chemical shifts of the i (self) and i-1 (previous) residue within a particular sequence. The foundation of these experiments is the 2D 15N heteronuclear single quantum coherence (HSQC) spectrum, which correlates a 1H atom to its directly-bonded 15N or 13C atom; a correlation which is primarily used to provide a map of the backbone amide and sidechain NH2 chemical shifts of every residue. This is followed by many more experiments which correlate 13C alpha and beta atoms of each residue to the amide carbonyl and HN groups of the previous residue, and as many intraresidue carbon atoms to their respective backbone amides and directly bonded hydrogens. Combined with the protein’s amino acid sequence, this data is then correlated to the HSQC spectrum where each peak is assigned to a particular residue, thus forming the chemical shift map of every residue (hopefully) of the protein.
The road to an NMR structure, however, requires more than just a map of assigned peak-residue chemical shifts. For full structure determination, a series of experiments must be performed to add “restraints”, which define the three dimensional positioning of the protein atoms with respect to each other, thus improving the quality and accuracy of the structure. The primary experiments used to obtain this information are nuclear overhauser effect spectroscopy (NOESY) which measures through-space interactions between protons (within ~5 Å), and residual dipolar coupling (RDC) experiments, which provide long-range structural information based on relative orientation of atoms rather than distance. Akin to crystallographic refinement, all the data is combined and fed into a program which is used to calculate and optimize distance restraints, dihedral angle constraints, H-bond distances, etc. The output is an ensemble of the lowest energy structures, the quality of which is defined by backbone, bond-length and bond-angle RMSDs, Ramachandran plot tolerances, etc.
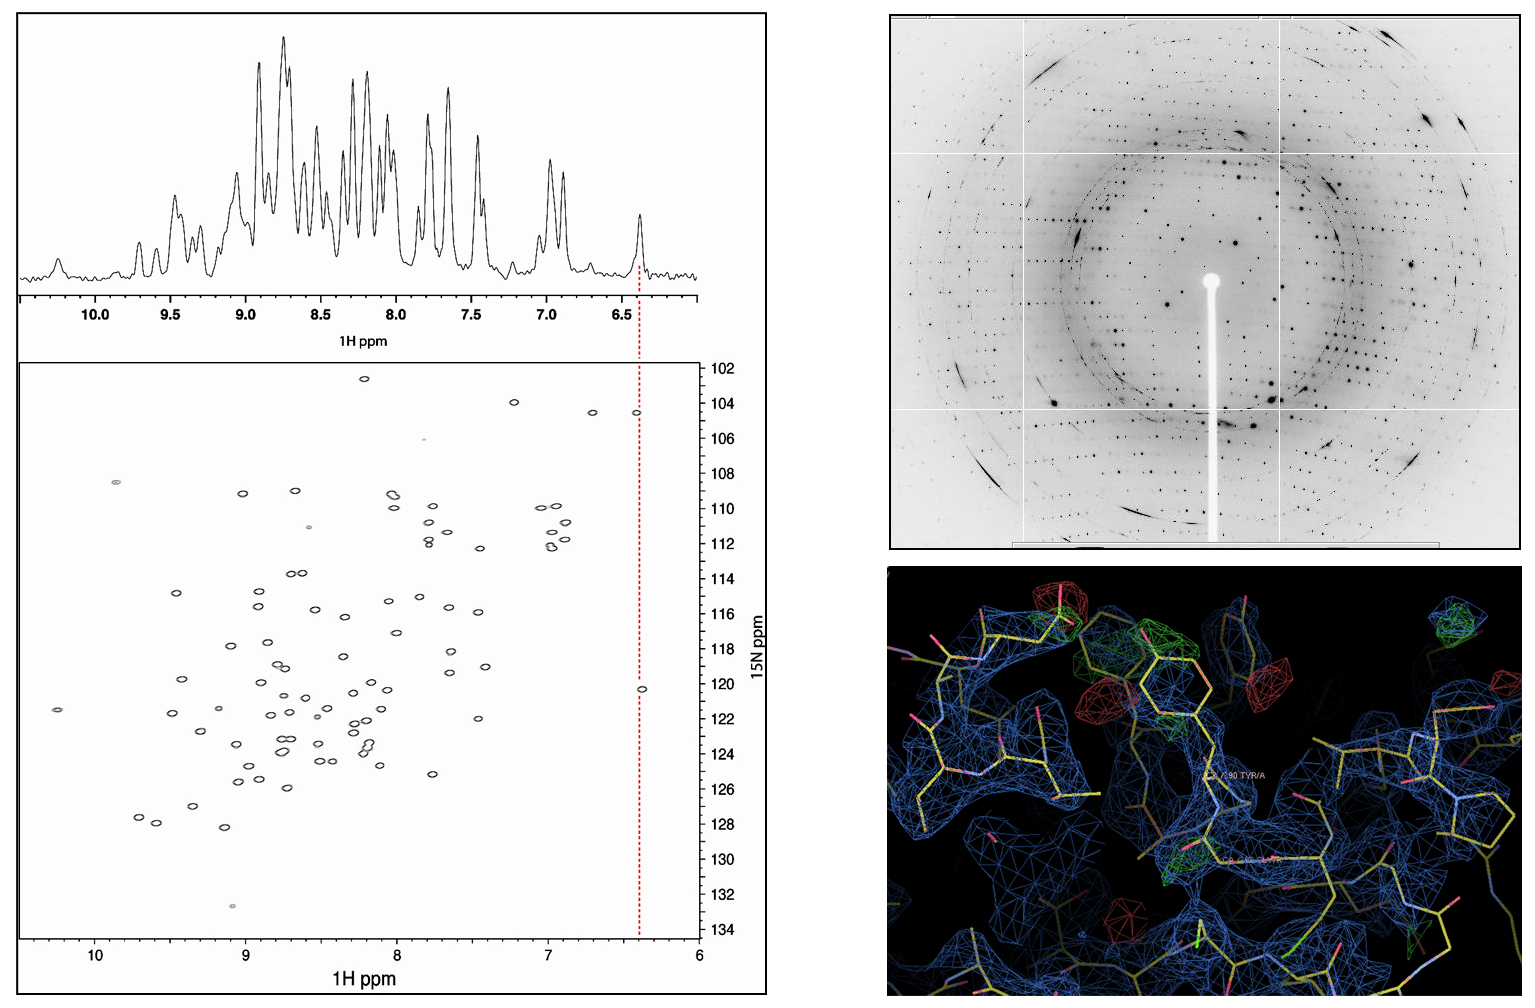
Figure 2: Left: Raw 1D (1H; top) and processed 2D (1H, 15N; bottom) protein NMR data, with chemical shifts indicated on the axes in parts per million (ppm)5. Right: Raw crystallographic diffraction pattern (top) and processed electron density fitted to protein sctructure (bottom).
Bottlenecks
Protein production
Obtaining a pure, highly concentrated (mM) protein sample is a major bottleneck for both x-ray crystallography and NMR. The high concentration is required because both techniques are insensitive to single molecule analysis, and a large population of a particular protein is required to overcome the signal-to-noise barrier. On a similar note the sample needs to be very homogenous, so protein purification is necessary at some point.
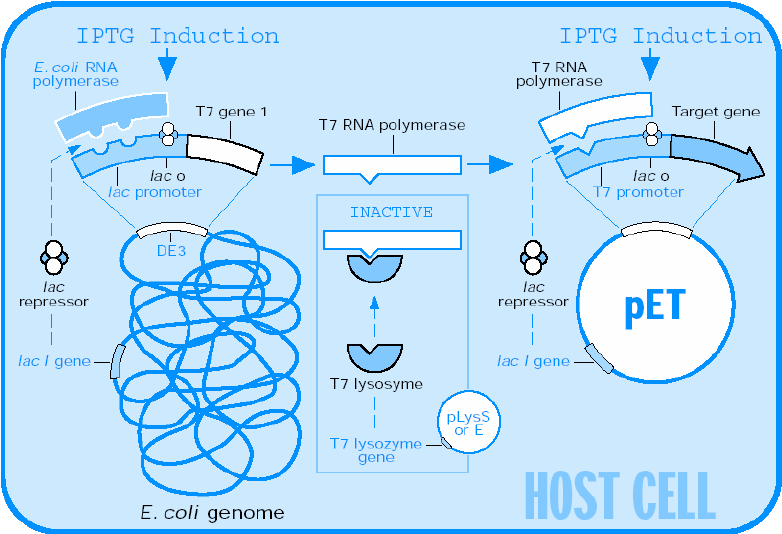
Recombinant protein production using E. coli is the method of choice when large quantities of protein are required. This process involves taking the gene (often cDNA) of the protein of interest, splicing it into a suitable inducible vector, transforming the vector into an E. coli host, and growing the culture in a rich medium. The bacterial host will multiply during a growth phase, after which it is induced to express the protein of interest. If all goes well, the protein will express solubly and in high numbers. Unfortunately, this process is easier said than done. Many eukaryotic proteins do not express well in prokaryotic hosts, and oftentimes modifications need to be made to optimize the bacterial host, codon usage, media, etc. to obtain a decent yield of recombinant protein. Additionally, proteins often express insolubly as inclusion bodies and require high concentrations (2M to 8M) of denaturants such as urea or guanidine hydrochloride to solubilize them, and then stepwise dialysis into an appropriate buffer to refold them. Alternatively, eukaryotic organisms such as S. cerevisiae (yeast), insect and mammalian cell lines can be used, especially when post-translation modifications are required, though a decrease in yield and increase in overall cost is common with these organisms.
The difficulty of protein production is compounded for NMR by the fact that all proteins need to be 15N and/or 13C labeled, as only these isotopes have nuclei with + ½ and - ½ spin states which enable the energy transitions required for a radiofrequency NMR signal; note that 1H also has ½ spin states but is highly abundant.
Table 1. Natural abundance of the most common isotopes used in NMR.1,4
| Nucleus | Natural abundance |
| 1H | 99.985 |
| 13C | 1.108 |
| 15N | 0.37 |
Additionally, deuteration of the protein (replacing hydrogens (1H) with NMR-silent deuterons (2H)) is often required for larger proteins and dynamics experiments in NMR. This process increases the stress on the recombinant organism producing the protein, which in turn decreases the yield and often drives the cost of production into the thousands of dollars.
Unfortunately, a high protein yield is only half the battle, as the protein of interest must then be purified from the cellular milieu. The purification method of choice is Fast Protein Liquid Chromatography (FPLC), as there are a vast number of chromatography media including metal-affinity, size-exclusion, hydrophobic interaction, and ion-exchange, readily available for use in purification. Additionally, many proteins are expressed with a variety of N- or C-terminus tags such as Histidine, Intein or SUMO that are highly specific to a particular kind of medium, thereby greatly facilitating the purification process. Naturally, these tags often need to be cleaved off the protein so as not to interfere with its folding, function, or crystallization. The purification process is not perfect, and often results in a 10-20% loss of protein simply through the process of handling the samples.
Table 2: Summary of protein expression and purification.
| Recombinant Cloning of DNA | Protein Expression | Protein Purification |
|
|
|
|
|
|
Nelson & Cox, Lehninger Principles of Biochemistry, 3rd ed. |
Protein stability and Crystallization
Protein stability is an issue for both crystallography and NMR. Once a protein has been expressed, purified, and concentrated, it must maintain its structural integrity for the duration of the experiments. For crystallography, this involves the crystallization process, where the protein sample is placed in a variety of solutions (most often involving high concentrations of polyethylene glycol) that induce crystallization. Often referred to as a voodoo technique, crystallization conditions are tested in a high throughput method using 96-well screening plates, and any hits are further optimized using a larger volume of the particular solution. While a crystallization condition may eventually be found, the process can take anywhere from a few days to even a year or two to happen, making the crystallization process the rate-limiting step for protein crystallographers. During this time, the protein must stay in solution and maintain its structure so as to produce a high quality crystal; a condition that is not often the case.

Figure 3: Left: Representative diagrams of crystal tray screening methods, including (A) hanging drop, (B) sitting drop and (C) microdialysis. Blue arrows represent vapor (A,B) and liquid (C) solute equilibrium. Right: Protein crystals! Image source: Wikipedia
Similarly, a stable, highly concentrated protein sample is required to perform many of the more advanced NMR experiments. This is because many of these experiments require days and even weeks to run, during which the homogeneity of the solution is key to acquiring quality spectra. Should the protein unfold or precipitate out of solution during an experiment, the resulting chemical change would either not produce any signal, or one which could not be used for structure/dynamics determination.
Protein size
One of the hallmarks of protein crystallography is that size does not matter. Whether one is working with a 25 kDa monomeric protein, or a 900 kDa multimeric complex, if it can be crystallized and produce a high-resolution diffraction pattern its structure can be determined. This is due to the fact that once in crystal form, a protein is in a more-or-less static conformation which, after passing it through the x-ray beam at different angles, can produce a single structural model. The same cannot be said for NMR.
In NMR, the protein is in a soluble state and therefore in constant movement. The most important movement that governs the spectral quality is that of the molecular tumbling rate. For proteins larger than about 40 kDa, the tumbling rate decreases significantly, in turn increasing the transverse relaxation rate (T2). Essentially, this results in a weaker and rapidly decaying NMR signal, which manifests itself in peak broadening and spectral overlap.
A number of techniques are available to combat the problem of peak broadening in NMR from larger molecular weight proteins. To increase the tumbling rate, for instance, experiments may be run at higher temperatures (though this may have adverse effects on protein stability). Additionally, deuteration (replacing 1H with 2H at all or select hydrogen sites – recall that 2H has a spin of 1 and is NMR silent) minimizes spin-spin interactions (fast T2 relaxation), thus decreasing relaxation times and spin diffusion to provide better linewidths and peak resolution. Lastly, a popular experiment to run on large proteins is transverse relaxation-optimized spectroscopy (TROSY), which uses constructive interference between relaxation mechanisms to exclusively select the slower relaxing resonances over the fast ones; this technique works best on high magnetic field strength spectrometers (greater than 700 MHz).
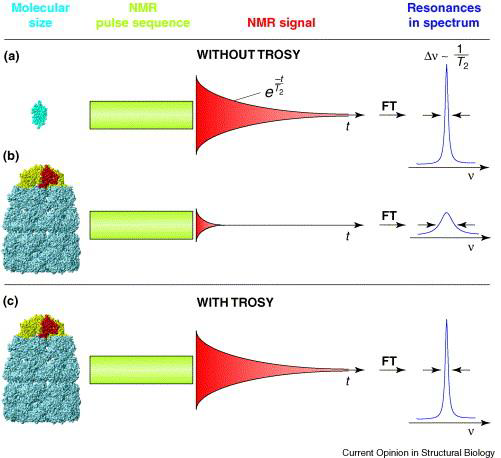
Figure 4: A schematic diagram of large-protein NMR with and without TROSY. "Resonances in spectrum" refers to NMR peak linewidth, with sharp peaks representing high resolution, and short, broad peaks representing low resolution spectra.6
Beyond structure
One of the major advantages of NMR is its ability to record small and large-scale protein dynamics, a phenomenon that is generally suppressed when a protein is crystallized. Although a crystallized protein may exhibit a certain amount of motion within the lattice, the motions manifest themselves as static or dynamic disorder, the former of which may result in two different conformations of a particular region, and the latter in averaged electron density. In general, crystallization may restrict a protein’s natural flexibility and motions.
Information obtainable from NMR dynamics experiments includes hydrogen bonding and exchange in enzymatic mechanisms, allosteric processes, and thermodynamic and kinetic selectivity in protein-protein and protein-ligand interactions. Experiments such as R1 (spin-lattice) , R2 (spin-spin), and steady-state NOE are useful in evaluating relaxation rates of particular residues, which provides insight into structural flexibility and conformational exchange rates. Coupled with CPMG (Carr-Purcell Meiboom-Gill) experiments, protein dynamics on the ps-ns timescales can be obtained in addition to those happening on the μs-ms timescale. Additionally, intrinsically disordered proteins exhibit a high degree of flexibility prior to contact with a ligand, cofactor, or receptor protein, after which a conformational change to a more ordered state takes place. This type of transition is highly amenable to NMR analysis through titration of the protein sample with the causative agent.
Crystallography, however, is not left in the cold when it comes to dynamic structure analysis. Time-resolved crystallography can be used to monitor changes in the protein structure upon addition of some ligand, or change in the environment. Because all protein crystals are highly hydrated, they are able to serve as crucibles for some biochemical reactions. The crystal is typically soaked in a solution containing the ligand of interest to initiate the biochemical reaction, after which the crystal is quickly placed into the beam-line and diffraction pattern is obtained. This can be performed multiple times if necessary to obtain a variety of structural intermediates. The process though requires many things to go right: the protein cannot become disordered nor should the crystal become cracked during the soaking process, and a high-powered synchrotron is required to collect high-quality diffraction data over short exposure times.
Make love, not war
In the end, protein x-ray crystallography and NMR spectroscopy are not mutually exclusive techniques; one can easily pick up where the other falls short. In analyzing NMR dynamics experiments, for example, one can greatly benefit from existing crystal structure data onto which the NMR structural data can be superimposed. Similarly, NMR structure data can be used to supplement a crystal structure with more information on the protein's dynamics, binding information, and conformational changes in solution. Because a protein that can be analyzed by NMR is not necessarily amenable to crystallization (and vice-versa), the two techniques, either alone or in conjunction with one another, serve as two of the top complementary methods for protein structure determination.
References
- Serdyuk, I.N., Zaccai, N.R., Zaccai, J. "Methods in Molecular Biophysics: Structure, Dynamics, Function". Cambridge University Pres, New York. (2007)
-
Snyder, D.A., et al. “Comparisons of NMR spectral quality and success in crystallization demonstrate that NMR and X-ray crystallography are complementary methods for small protein structure determination". J. Am. Chem. Soc. 127, 16505−16511 (2005).
-
Joshi A, Esteve V, Buckroyd AN, Blatter M, Allain FH-, Curry S. “Solution and crystal structures of a C-terminal fragment of the neuronal isoform of the polypyrimidine tract binding protein (nPTB)”. PeerJ 2:e305 (2014)
-
Crowhurst, K. Lecture notes. California State University Northridge.
-
Fernandez, C., Wider, G. "TROSY in NMR studies of the structure and function of large biological macromolecules". Curr. Opin. Struct. Bio.,13, 570-580 (2003).