
2.2: Activities
- Page ID
- 22668

\( \newcommand{\vecs}[1]{\overset { \scriptstyle \rightharpoonup} {\mathbf{#1}} } \)
\( \newcommand{\vecd}[1]{\overset{-\!-\!\rightharpoonup}{\vphantom{a}\smash {#1}}} \)
\( \newcommand{\dsum}{\displaystyle\sum\limits} \)
\( \newcommand{\dint}{\displaystyle\int\limits} \)
\( \newcommand{\dlim}{\displaystyle\lim\limits} \)
\( \newcommand{\id}{\mathrm{id}}\) \( \newcommand{\Span}{\mathrm{span}}\)
( \newcommand{\kernel}{\mathrm{null}\,}\) \( \newcommand{\range}{\mathrm{range}\,}\)
\( \newcommand{\RealPart}{\mathrm{Re}}\) \( \newcommand{\ImaginaryPart}{\mathrm{Im}}\)
\( \newcommand{\Argument}{\mathrm{Arg}}\) \( \newcommand{\norm}[1]{\| #1 \|}\)
\( \newcommand{\inner}[2]{\langle #1, #2 \rangle}\)
\( \newcommand{\Span}{\mathrm{span}}\)
\( \newcommand{\id}{\mathrm{id}}\)
\( \newcommand{\Span}{\mathrm{span}}\)
\( \newcommand{\kernel}{\mathrm{null}\,}\)
\( \newcommand{\range}{\mathrm{range}\,}\)
\( \newcommand{\RealPart}{\mathrm{Re}}\)
\( \newcommand{\ImaginaryPart}{\mathrm{Im}}\)
\( \newcommand{\Argument}{\mathrm{Arg}}\)
\( \newcommand{\norm}[1]{\| #1 \|}\)
\( \newcommand{\inner}[2]{\langle #1, #2 \rangle}\)
\( \newcommand{\Span}{\mathrm{span}}\) \( \newcommand{\AA}{\unicode[.8,0]{x212B}}\)
\( \newcommand{\vectorA}[1]{\vec{#1}} % arrow\)
\( \newcommand{\vectorAt}[1]{\vec{\text{#1}}} % arrow\)
\( \newcommand{\vectorB}[1]{\overset { \scriptstyle \rightharpoonup} {\mathbf{#1}} } \)
\( \newcommand{\vectorC}[1]{\textbf{#1}} \)
\( \newcommand{\vectorD}[1]{\overrightarrow{#1}} \)
\( \newcommand{\vectorDt}[1]{\overrightarrow{\text{#1}}} \)
\( \newcommand{\vectE}[1]{\overset{-\!-\!\rightharpoonup}{\vphantom{a}\smash{\mathbf {#1}}}} \)
\( \newcommand{\vecs}[1]{\overset { \scriptstyle \rightharpoonup} {\mathbf{#1}} } \)
\(\newcommand{\longvect}{\overrightarrow}\)
\( \newcommand{\vecd}[1]{\overset{-\!-\!\rightharpoonup}{\vphantom{a}\smash {#1}}} \)
\(\newcommand{\avec}{\mathbf a}\) \(\newcommand{\bvec}{\mathbf b}\) \(\newcommand{\cvec}{\mathbf c}\) \(\newcommand{\dvec}{\mathbf d}\) \(\newcommand{\dtil}{\widetilde{\mathbf d}}\) \(\newcommand{\evec}{\mathbf e}\) \(\newcommand{\fvec}{\mathbf f}\) \(\newcommand{\nvec}{\mathbf n}\) \(\newcommand{\pvec}{\mathbf p}\) \(\newcommand{\qvec}{\mathbf q}\) \(\newcommand{\svec}{\mathbf s}\) \(\newcommand{\tvec}{\mathbf t}\) \(\newcommand{\uvec}{\mathbf u}\) \(\newcommand{\vvec}{\mathbf v}\) \(\newcommand{\wvec}{\mathbf w}\) \(\newcommand{\xvec}{\mathbf x}\) \(\newcommand{\yvec}{\mathbf y}\) \(\newcommand{\zvec}{\mathbf z}\) \(\newcommand{\rvec}{\mathbf r}\) \(\newcommand{\mvec}{\mathbf m}\) \(\newcommand{\zerovec}{\mathbf 0}\) \(\newcommand{\onevec}{\mathbf 1}\) \(\newcommand{\real}{\mathbb R}\) \(\newcommand{\twovec}[2]{\left[\begin{array}{r}#1 \\ #2 \end{array}\right]}\) \(\newcommand{\ctwovec}[2]{\left[\begin{array}{c}#1 \\ #2 \end{array}\right]}\) \(\newcommand{\threevec}[3]{\left[\begin{array}{r}#1 \\ #2 \\ #3 \end{array}\right]}\) \(\newcommand{\cthreevec}[3]{\left[\begin{array}{c}#1 \\ #2 \\ #3 \end{array}\right]}\) \(\newcommand{\fourvec}[4]{\left[\begin{array}{r}#1 \\ #2 \\ #3 \\ #4 \end{array}\right]}\) \(\newcommand{\cfourvec}[4]{\left[\begin{array}{c}#1 \\ #2 \\ #3 \\ #4 \end{array}\right]}\) \(\newcommand{\fivevec}[5]{\left[\begin{array}{r}#1 \\ #2 \\ #3 \\ #4 \\ #5 \\ \end{array}\right]}\) \(\newcommand{\cfivevec}[5]{\left[\begin{array}{c}#1 \\ #2 \\ #3 \\ #4 \\ #5 \\ \end{array}\right]}\) \(\newcommand{\mattwo}[4]{\left[\begin{array}{rr}#1 \amp #2 \\ #3 \amp #4 \\ \end{array}\right]}\) \(\newcommand{\laspan}[1]{\text{Span}\{#1\}}\) \(\newcommand{\bcal}{\cal B}\) \(\newcommand{\ccal}{\cal C}\) \(\newcommand{\scal}{\cal S}\) \(\newcommand{\wcal}{\cal W}\) \(\newcommand{\ecal}{\cal E}\) \(\newcommand{\coords}[2]{\left\{#1\right\}_{#2}}\) \(\newcommand{\gray}[1]{\color{gray}{#1}}\) \(\newcommand{\lgray}[1]{\color{lightgray}{#1}}\) \(\newcommand{\rank}{\operatorname{rank}}\) \(\newcommand{\row}{\text{Row}}\) \(\newcommand{\col}{\text{Col}}\) \(\renewcommand{\row}{\text{Row}}\) \(\newcommand{\nul}{\text{Nul}}\) \(\newcommand{\var}{\text{Var}}\) \(\newcommand{\corr}{\text{corr}}\) \(\newcommand{\len}[1]{\left|#1\right|}\) \(\newcommand{\bbar}{\overline{\bvec}}\) \(\newcommand{\bhat}{\widehat{\bvec}}\) \(\newcommand{\bperp}{\bvec^\perp}\) \(\newcommand{\xhat}{\widehat{\xvec}}\) \(\newcommand{\vhat}{\widehat{\vvec}}\) \(\newcommand{\uhat}{\widehat{\uvec}}\) \(\newcommand{\what}{\widehat{\wvec}}\) \(\newcommand{\Sighat}{\widehat{\Sigma}}\) \(\newcommand{\lt}{<}\) \(\newcommand{\gt}{>}\) \(\newcommand{\amp}{&}\) \(\definecolor{fillinmathshade}{gray}{0.9}\)Equipment
- butcher paper
- masking tape
- launch ramp
- a steel marble
- carbon paper
- meter stick
- plumb bob
The General Idea
Consider the somewhat contrived story...
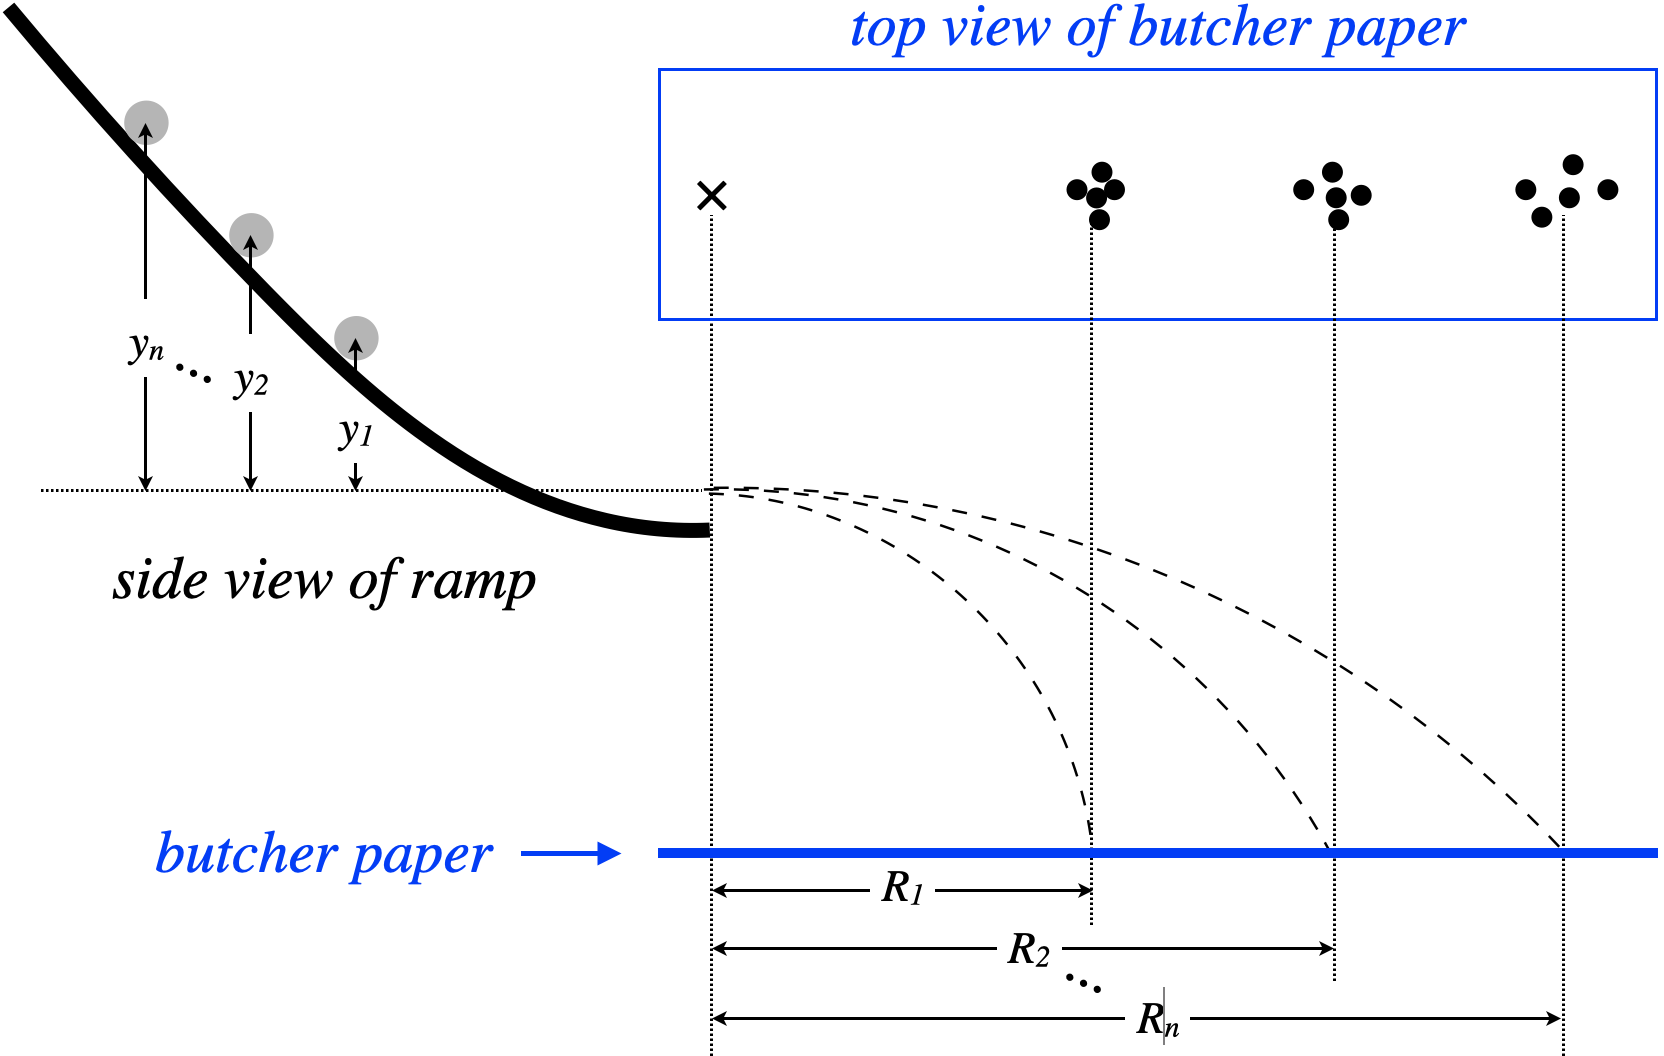
A bitter controversy has recently broken out between the residents of a new housing development in the foothills and the Town Council over the safety of a number of large rocks perched on the slope of a hill that ends with a cliff, down to a lake, on the opposite side of which is the housing development. At the heart of the dispute is the relationship between the height above the edge of the cliff at which the rocks are balanced (\(y\)) and the distance, horizontally from the base of the cliff, to which the rocks will range (\(R\)) should they roll down the hill and fly off the cliff. Neither party is convinced by fancy physics calculations, so they both hired engineering firms to conduct modeled experiments to come to a conclusion.
Figure 2.1.1 – Engineers' Experimental Model
One group of engineers concluded that \(y\) and \(R\) are related by:
\[y\propto R\]
A second engineering firm concluded that \(y\) and \(R\) are related by:
\[y\propto R^2\]
Further calculations reveal that if the trajectories obey the linear relation, then some of the rocks starting higher on the hill will fly over the lake and land within the housing development, but if the quadratic relation holds, then even the highest rocks on the hill will land in the lake, leaving the housing development undamaged.
Your Task: Set up the same experiment performed by the two engineering firms, and use the graphical technique discussed in the Background Material to draw a conclusion about which of the two relationships given above is the correct one.
Some Things to Think About
As you launch into this experiment, here are a few basic considerations to help you accomplish your goal:
- You are trying to decide between two different functions that may be difficult to distinguish from each other unless one is smart about taking data. One important bit of advice in this regard is in the final paragraph of the Background Material. It mentions the scaling of the graphs, but how will you perform your experiment to also help in this regard?
- One of the pieces of equipment is a plumb bob. This device is used to connect two points along a vertical line. How is this useful for this experiment?
- Humans make all sorts of errors when running experiments. In this case, one might record the wrong starting height, or accidentally give the marble a small push. How will you protect against the effect of such errors?
- The engineer's model assumes that the rolling marbles leave the cliff horizontally.
- All the experimental runs are performed on the same piece of paper. How bad would it be if the position of this paper is accidentally changed between runs?
- As is often the case, the keys to a successful experiment are planning (for which there are hints above), and a well-organized, orderly table of data and computed values.
[As promised in the previous lab, from this point on in Physics 9 labs, you will be given only basic guidance (such as the few tips above). Setting up the means by which you take data and writing the report will be up to your group.]
Graphing
For this lab and future labs that involve graphs, you are free to do these however you wish – you can graph the data by hand or use software. One tool you might find useful is this online graphing calculator. If you click the "+" button in the upper-left corner and selecting "table", you can enter your data into a table and the points will be plotted. Then in the upper-right corner you can click the "share your graph" icon, which will allow you to print it (which you can do on the lab printer) or save as a document. For this lab, we are only looking for the data that looks linear; we are not interested in the actual straight line that best fits the data.
Lab Report
Craft a lab report for these activities and analysis, making sure to include every contributing group member's name on the front page. You are strongly encouraged to refer back to the Read Me as you do this, to make sure that you are not leaving out anything important. You should also feel free to get feedback from your lab TA whenever you find that your group requires clarification or is at an impasse.
Every member of the group must upload a separate digital copy of the report to their lab assignment in Canvas prior to leaving the lab classroom. These reports are not to be written outside the lab setting.