
Dynamic Force Spectroscopy
- Page ID
- 762
\( \newcommand{\vecs}[1]{\overset { \scriptstyle \rightharpoonup} {\mathbf{#1}} } \)
\( \newcommand{\vecd}[1]{\overset{-\!-\!\rightharpoonup}{\vphantom{a}\smash {#1}}} \)
\( \newcommand{\dsum}{\displaystyle\sum\limits} \)
\( \newcommand{\dint}{\displaystyle\int\limits} \)
\( \newcommand{\dlim}{\displaystyle\lim\limits} \)
\( \newcommand{\id}{\mathrm{id}}\) \( \newcommand{\Span}{\mathrm{span}}\)
( \newcommand{\kernel}{\mathrm{null}\,}\) \( \newcommand{\range}{\mathrm{range}\,}\)
\( \newcommand{\RealPart}{\mathrm{Re}}\) \( \newcommand{\ImaginaryPart}{\mathrm{Im}}\)
\( \newcommand{\Argument}{\mathrm{Arg}}\) \( \newcommand{\norm}[1]{\| #1 \|}\)
\( \newcommand{\inner}[2]{\langle #1, #2 \rangle}\)
\( \newcommand{\Span}{\mathrm{span}}\)
\( \newcommand{\id}{\mathrm{id}}\)
\( \newcommand{\Span}{\mathrm{span}}\)
\( \newcommand{\kernel}{\mathrm{null}\,}\)
\( \newcommand{\range}{\mathrm{range}\,}\)
\( \newcommand{\RealPart}{\mathrm{Re}}\)
\( \newcommand{\ImaginaryPart}{\mathrm{Im}}\)
\( \newcommand{\Argument}{\mathrm{Arg}}\)
\( \newcommand{\norm}[1]{\| #1 \|}\)
\( \newcommand{\inner}[2]{\langle #1, #2 \rangle}\)
\( \newcommand{\Span}{\mathrm{span}}\) \( \newcommand{\AA}{\unicode[.8,0]{x212B}}\)
\( \newcommand{\vectorA}[1]{\vec{#1}} % arrow\)
\( \newcommand{\vectorAt}[1]{\vec{\text{#1}}} % arrow\)
\( \newcommand{\vectorB}[1]{\overset { \scriptstyle \rightharpoonup} {\mathbf{#1}} } \)
\( \newcommand{\vectorC}[1]{\textbf{#1}} \)
\( \newcommand{\vectorD}[1]{\overrightarrow{#1}} \)
\( \newcommand{\vectorDt}[1]{\overrightarrow{\text{#1}}} \)
\( \newcommand{\vectE}[1]{\overset{-\!-\!\rightharpoonup}{\vphantom{a}\smash{\mathbf {#1}}}} \)
\( \newcommand{\vecs}[1]{\overset { \scriptstyle \rightharpoonup} {\mathbf{#1}} } \)
\(\newcommand{\longvect}{\overrightarrow}\)
\( \newcommand{\vecd}[1]{\overset{-\!-\!\rightharpoonup}{\vphantom{a}\smash {#1}}} \)
\(\newcommand{\avec}{\mathbf a}\) \(\newcommand{\bvec}{\mathbf b}\) \(\newcommand{\cvec}{\mathbf c}\) \(\newcommand{\dvec}{\mathbf d}\) \(\newcommand{\dtil}{\widetilde{\mathbf d}}\) \(\newcommand{\evec}{\mathbf e}\) \(\newcommand{\fvec}{\mathbf f}\) \(\newcommand{\nvec}{\mathbf n}\) \(\newcommand{\pvec}{\mathbf p}\) \(\newcommand{\qvec}{\mathbf q}\) \(\newcommand{\svec}{\mathbf s}\) \(\newcommand{\tvec}{\mathbf t}\) \(\newcommand{\uvec}{\mathbf u}\) \(\newcommand{\vvec}{\mathbf v}\) \(\newcommand{\wvec}{\mathbf w}\) \(\newcommand{\xvec}{\mathbf x}\) \(\newcommand{\yvec}{\mathbf y}\) \(\newcommand{\zvec}{\mathbf z}\) \(\newcommand{\rvec}{\mathbf r}\) \(\newcommand{\mvec}{\mathbf m}\) \(\newcommand{\zerovec}{\mathbf 0}\) \(\newcommand{\onevec}{\mathbf 1}\) \(\newcommand{\real}{\mathbb R}\) \(\newcommand{\twovec}[2]{\left[\begin{array}{r}#1 \\ #2 \end{array}\right]}\) \(\newcommand{\ctwovec}[2]{\left[\begin{array}{c}#1 \\ #2 \end{array}\right]}\) \(\newcommand{\threevec}[3]{\left[\begin{array}{r}#1 \\ #2 \\ #3 \end{array}\right]}\) \(\newcommand{\cthreevec}[3]{\left[\begin{array}{c}#1 \\ #2 \\ #3 \end{array}\right]}\) \(\newcommand{\fourvec}[4]{\left[\begin{array}{r}#1 \\ #2 \\ #3 \\ #4 \end{array}\right]}\) \(\newcommand{\cfourvec}[4]{\left[\begin{array}{c}#1 \\ #2 \\ #3 \\ #4 \end{array}\right]}\) \(\newcommand{\fivevec}[5]{\left[\begin{array}{r}#1 \\ #2 \\ #3 \\ #4 \\ #5 \\ \end{array}\right]}\) \(\newcommand{\cfivevec}[5]{\left[\begin{array}{c}#1 \\ #2 \\ #3 \\ #4 \\ #5 \\ \end{array}\right]}\) \(\newcommand{\mattwo}[4]{\left[\begin{array}{rr}#1 \amp #2 \\ #3 \amp #4 \\ \end{array}\right]}\) \(\newcommand{\laspan}[1]{\text{Span}\{#1\}}\) \(\newcommand{\bcal}{\cal B}\) \(\newcommand{\ccal}{\cal C}\) \(\newcommand{\scal}{\cal S}\) \(\newcommand{\wcal}{\cal W}\) \(\newcommand{\ecal}{\cal E}\) \(\newcommand{\coords}[2]{\left\{#1\right\}_{#2}}\) \(\newcommand{\gray}[1]{\color{gray}{#1}}\) \(\newcommand{\lgray}[1]{\color{lightgray}{#1}}\) \(\newcommand{\rank}{\operatorname{rank}}\) \(\newcommand{\row}{\text{Row}}\) \(\newcommand{\col}{\text{Col}}\) \(\renewcommand{\row}{\text{Row}}\) \(\newcommand{\nul}{\text{Nul}}\) \(\newcommand{\var}{\text{Var}}\) \(\newcommand{\corr}{\text{corr}}\) \(\newcommand{\len}[1]{\left|#1\right|}\) \(\newcommand{\bbar}{\overline{\bvec}}\) \(\newcommand{\bhat}{\widehat{\bvec}}\) \(\newcommand{\bperp}{\bvec^\perp}\) \(\newcommand{\xhat}{\widehat{\xvec}}\) \(\newcommand{\vhat}{\widehat{\vvec}}\) \(\newcommand{\uhat}{\widehat{\uvec}}\) \(\newcommand{\what}{\widehat{\wvec}}\) \(\newcommand{\Sighat}{\widehat{\Sigma}}\) \(\newcommand{\lt}{<}\) \(\newcommand{\gt}{>}\) \(\newcommand{\amp}{&}\) \(\definecolor{fillinmathshade}{gray}{0.9}\)Dynamic Force Spectroscopy (DFS) is a method used to measure binding properties of biomolecules. The main idea behind DFS is to measure the force it takes to manipulate (ie stretching, twisting, pushing, etc) a biomolecule or biomolecular complex. The term 'spectroscopy' refers to the interaction of matter and radiation. However, dynamic force spectroscopy doesn't use light and matter interactions directly so the term can be misleading.
Scientists use DFS to measure bond strength so it’s best to define what exactly bond strength is. From a biochemistry perspective, bond strength is dictated by the free energy difference between bound and free states, also known as the binding energy. From a physics and classical mechanics perspective, bond strength is simply the force required to separate two interacting molecules. Both perspectives are incomplete, however. Force is missing from the biochemical perspective, and time and temperature are missing from the physics perspective. Ultimately, this means that using DFS for studying even single bonds is not a trivial matter. Bond strengths measured using DFS methods are often reported as distributions (rather than discrete values) of force vs. the logarithm of the loading rate.
Experimental Methods
The three most common apparatuses used for DFS are the atomic force microscope (AFM), optical tweezers, and a biomembrane force probe. Details of each of these tools are outlined below. In theory, each of these probes acts as spring with a spring constant K, where measured displacements can easily be converted to forces (Hooke’s Law).
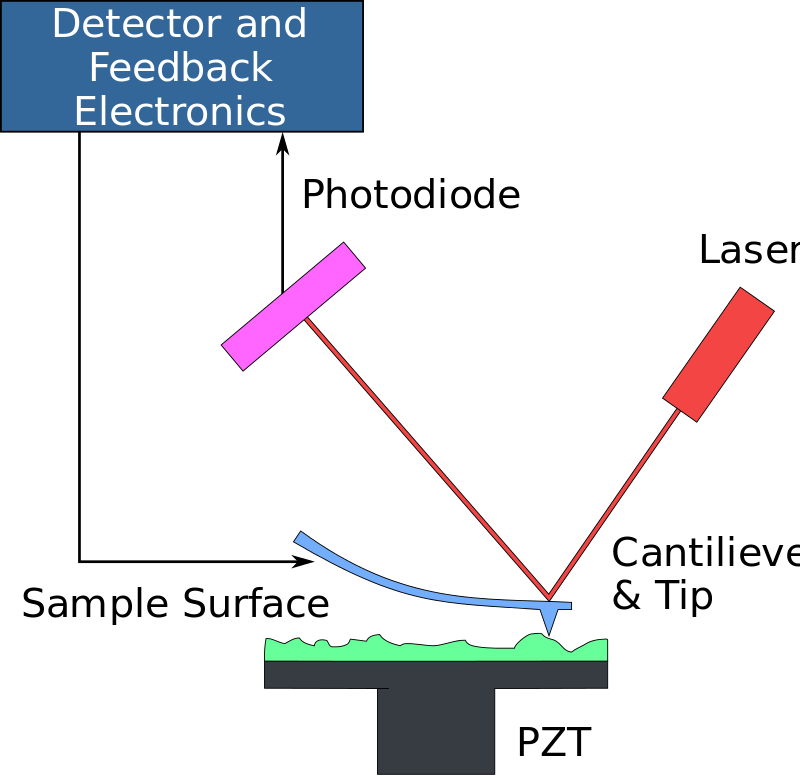
Each of these techniques allows forces to be measured on the pico-Newton (pN) scale, which is small enough to measure the breaking of a single hydrogen bond. Therefore, it logically follows that the probes used in DFS methods are also very sensitive to interactions with the surface of interest. For example, when an AFM tip approaches a sample, electrostatic forces begin acting on the tip when the separation distance is still a few microns. As the tip comes within nanometers of the sample, Van der Waals forces, capillary forces, chemical potential, solvation forces, and even magnetic forces become prominent. These weak forces eventually sum to an attractive force that causes the tip to contact the sample. The adhesive strength between the probe and the sample is what is ultimately measured when the probe is pulled away from the sample, also known as the rupture force. The rupture force is the force required to break apart the interaction being investigated, in the units of Newtons. Depending on the sample of interest, non-specific binding, ligand-receptor binding, DNA hybridization, and cell surface interactions can cause strong adhesion. Even as the tip is being pulled away from the sample, protein unfolding, entropic elasticity, or other conformational changes allow the tip and the sample to continue interacting until the connection is completely broken.
Atomic Force Microscope (AFM)
Applications
Biomembrane Force Probe (BFP)

Applications
Cell to cell interactions, antigen to antibody interactions, and ligand – receptor interactions can all be measured by use of the biomembrane force probe technique. An example of measuring the force for a ligand-receptor interaction provides an idea of how this technique works:
A streptavidin-coated bead is covered with ligands of interest and the red blood cell it is attached to simply act as a force transducer. The streptavidin-coated bead interacts with the complementary receptors, biotin, on the surface of a target such as a living cell, another bead, or a vesicle attached to another micropipette. As the two pipettes are pulled away from each other, the force of the ligand-receptor interactions can be measured.
As with AFM techniques, the rupture force measured using a biomembrane force probe depends on many variables. The study of how the interaction changes will pulling speed, v, and how long the two surfaces are allowed to interact allows scientist to from a dynamic force spectrum of the bond. Rupture force distributions of a bond at different loading rates are used to determine the dynamic force spectra of the interaction. The slopes obtained in the dynamic force spectra correspond to a given barrier (\(\Delta E\)) in the energy landscape of the bond. The energy landscape refers to the energy barriers of the system to go from a bound to unbound state.
References
- Evstigneev, M., et al. Dynamic Force Spectroscopy on Single Molecules. Arizona State University, 2012.
- Gourier, C., et al. "A Nanospring Named Erythrocyte. The Biomembrane Force Probe". Cellular and Molecular Bioengineering, 3.1:263-275, 2008.
- Neuman, K. "Single-molecule force spectroscopy: optical tweezers, magnetic tweezers and atomic force microscopy". Nature Methods 5:491 - 505, 2008.
- Merkel, R., et al. "Energy landscapes of receptor-ligand bonds explored with dynamic force spectroscopy". Nature, pp. 50, 1999.
- Evans, E. and Willaims, P. Dynamic Force Spectroscopy. Boston University, 2002.
- Rief, M. and Grubmueller, H. Force spectroscopy of single biomolecules. Chem. Phys. 57:255-261, 2001.
- Heinrich, V. Lecture Notes. Univeristy of California Davis, 2014.