
5.2: Measuring the Nightly Path of the Moon


- Last updated
- Nov 1, 2022
- Save as PDF

( \newcommand{\kernel}{\mathrm{null}\,}\)
There is a misconception that ‘doing real astronomy’ is difficult and expensive, only highly trained and generously funded people can do it; this book is designed to show that both of these ideas are false. Measuring the Moon’s orbital path through the sky is simple enough that a seven year old can do it in their own back yard with a little parental help.
This activity is simple enough in concept, and can be conducted any night the Moon is visible for several hours in the sky; practically speaking, this works best in the week between first quarter moon and full moon. Students will be taking an altitude and azimuth measurement of the Moon every hour for 4-5 hours. At least four separate measurements are needed for best results. The Moon’s diurnal motion will be plotted on a simple graph after the measurements are taken.
Science and Engineering Practices
- Asking questions and defining problems.
- Planning and carrying out investigations.
- Analyzing and interpreting data.
- Using mathematics.
- Obtain, evaluate, and communicate information.
Crosscutting Concepts
- Patterns in nature.
- Scale, proportion, and quantity.
- Stability and change.
Next Generation Science Standards
- Space systems (K-5, 6-8, 9-12).
- The Earth-Moon system (6-8, 9-12).
- Gravitation and orbits (6-8, 9-12).
For the Educator
Facts you need to know
- The Moon’s nightly path across the sky is apparent motion. This movement is actually an illusion caused by the rotation of the Earth.
- We see moonrise and moonset primarily because the Earth spins on its axis once every 24 hours.
- When we measure the Moon’s nightly motion, we are actually measuring the rotational motion of the Earth.
Teaching and Pedagogy
This activity is certainly about applying the measuring skills that we learned in Activity #9, but it does more than that. This activity allows students to take real measurements and then plot them out on a graph to help them understand what is actually happening in the sky as they watch the Moon sink toward the western horizon.
All too often, graphing is put forward with data that is detached from reality – this activity puts the activity of graphing solidly in the child’s realm of experience and allows them to see that mathematics and graphing have a concrete benefit in real-world situations.
Even if you think that the graphing activity is a bit too much for your younger students, you can still take these measurements and plot them on the board together. This activity makes a wonderful introduction to graphing and its power to reveal mathematical truths in an appealing, visual format.
Student Outcomes
What will the student discover?
- The sky is always changing! The idea that things in the sky are constant and unchanging is a common misconception. By observing the sky over just a few hours, students will see that the objects in the sky move, changing position in a regular way.
- Math helps us describe the change we see in a clear and precise way. Students often ask: “What do we need this for?” By adding numbers into our lessons in a natural way, we show our students that math is good for something, it isn’t just a puzzle to solve and struggle over!
- Things that look the same are not always identical. The idea of observing the Moon for a few hours one night – and then doing the same observation at the same time over several nights – might seem nonsensical. But there is power in observation, on one night, we see the Earth spinning. Over several nights, we see the Moon moving around the Earth in orbit!
What will your students learn about science?
- These activities bring home to students that there is no such thing as ‘just looking’ or ‘just measuring’. Just like playing the violin or dribbling a soccer ball, observing and then carefully measuring and recording what you see are skills that require patience and discipline to master.
- Some students may feel frustrated at first when they try these activities, especially if they do not get the quick and easy results they had been expecting. To be quite frank, some teachers delving into STEM science activities in the classroom for the first time often feel the same!
- Remind your students (and yourself!) that simple isn’t always easy! This elementary fact is a stumbling block for students of every age and academic level. The corollary idea that diligent practice brings results is also worth teaching – and remembering! As you and your students practice these activities together, your results and consistency will improve over time!
- Science often does not proceed smoothly. Often there are bumps and missteps along the way. As we have seen with Aristotle’s Earth-centered model of the solar system, sometimes these wrong ideas can persist for a very long time! It is good for our students to understand that science is a practical skill, not unlike playing a sport or a musical instrument; it requires some talent, (and lots of practice!) to excel at it.
Conducting the Activity
Materials
- A ruler marked in centimeters
- A yardstick, tape measure, or a ruler marked in inches will work equally well – the measurements just need to be converted before plotting them on a graph.
- A compass for measuring direction.
- If the student doesn’t have a compass, the parent’s phone will suffice. Most smart phones already have a compass app on them – if not, there are many free apps of this type readily available.
Measuring the Moon’s Nightly Path Across the Sky
- Begin at sunset by measuring the altitude ofthe Moon with a ruler – this is the Moon’s apparent distance above the horizon. Hold the ruler at arm’s length and measure the distance from the horizon to the center of the Moon’s disk.
- If the Moon is too high off the horizon to measure with a simple ruler, try stretching a piece of string from the horizon to the Moon’s altitude, tie a knot to mark the length and then measure the string later.
- If your ruler does not show centimeters, that’s okay! Just take the altitude in inches and multiply by 2.5 to get centimeters – and degrees!
- Example: The string measures as 18 inches. 18 x 2.5 = 45 cm = 45 degrees altitude!
- Measure the azimuth of the Moon with a compass. The easiest way to do this is with a compass app on a smartphone. Point the smartphone at the Moon and read the azimuth angle off the display. If you use a conventional compass, keep the needle aligned with north, then look in the direction of the Moon and find the azimuth bearing. Use the instructions that come with the compass to help you.
- Repeat the exercise, measuring the altitude and azimuth position 4-5 times. Measurements should be taken at least 45 minutes apart to insure that the Moon has moved measurably. Record your measurements: time, altitude, and azimuth neatly each time so you can graph them later.
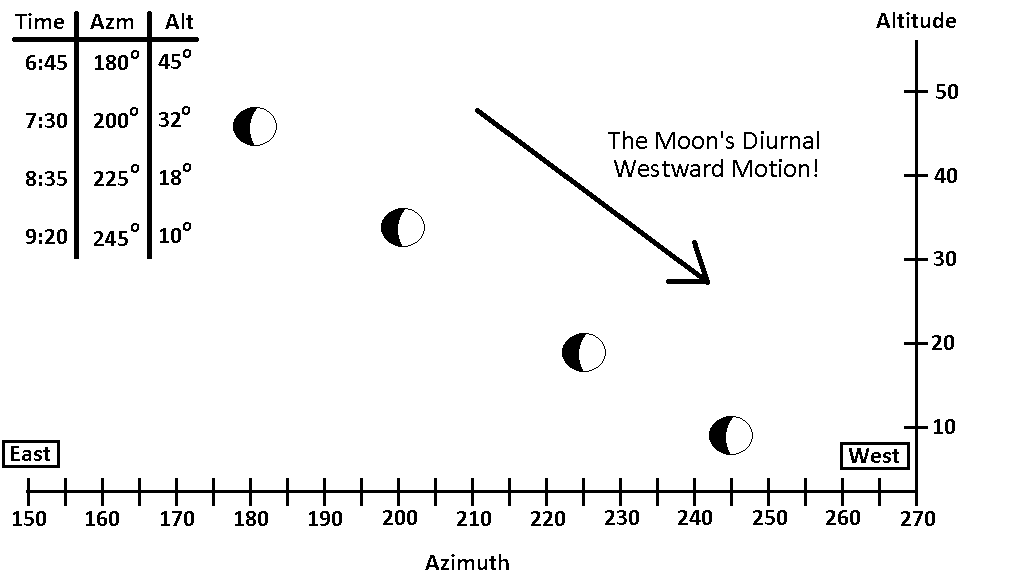
- The next day in class, plot out your Moon position data on a graph as shown below. You can use color-dot stickers to plot the Moon’s position and color in the phase if you like!
Discussion Questions
- How do the ideas of altitude and azimuth fit into this activity?
- Answer With any graph, we need two measurements to locate a point. In math, we normally label one axis x and the other axis y. In this activity, the vertical axis is altitude (the distance off the horizon) and the horizontal axis is azimuth (the compass direction).
- Graphs in math usually show locations (points) or equations (lines), what does this graph show?
- Answer: The diurnal (daily) motion of the Moon across the sky.
- What is causing the motion of the Moon that we see in a single evening as it sinks toward the horizon?
- Answer The rotation of the Earth (The Moon actually moves from west to east!)
Supplemental Materials
Going Deeper
This time, our Going Deeper activity asks our students to change the time scale of the activity. Instead of observing the Moon for a few hours over the course of one evening, this activity asks them to observe consistently for 5-7 successive nights. While this may seem like a small change, the requirement to continue an investigation in a focused way over a longer period of time is excellent exercise for the gifted child, it teaches persistence and resilience as well as scientific facts. You will find precise instructions for this in Activity #11.
It is also useful to know that this activity, although superficially the same, really measures something quite different! Observing the Moon’s motion for a few hours over a single evening shows us the Moon’s east to west motion which is due to the Earth’s rotation every 24 hours on its own axis.
However, when we observe the Moon at the same time over a period of days, we are now recording something very different. We are now measuring the Moon’s orbital motion as it travels around the Earth each month!
This difference will become apparent when your students plot their data on the graph. Instead of seeing the points move from left to right (east to west) across the paper, the new graph shows the points moving the other direction – west to east! This is because the Moon in orbit actually moves eastward across the sky as it circles the Earth in space.
Being a Scientist
Part of the power of science is when we add careful numerical measurements to our observations, wonderful mathematical patterns emerge that help us understand, and predict Nature.
When we see anything moving, one natural question to ask is: “How fast is it going?” There are many ways to answer such a question; it is common to measure speed in either miles (or kilometers) per hour.
This is not the only way to measure speed! When something moves in a circle like the Moon circling the Earth, we don’t measure its change in distance because the Moon is always about the same distance away from the Earth. Instead, we measure degrees instead of miles or kilometers.
Your activity is already doing this; when students record the compass direction of the Moon in degrees, they are measuring the Moon’s position. By adding the time of day to each observation, they will have everything they need to measure the Moon’s angular velocity in degrees per minute.
Look at the example data chart below. The student records time and compass position of the Moon in the first two columns. To get degrees moved, start with position #2 and subtract the value above – here we subtract 202 – 185 = 17 degrees. Time is treated in the same way – here we get 62 minutes from 6:18 to 7:18.
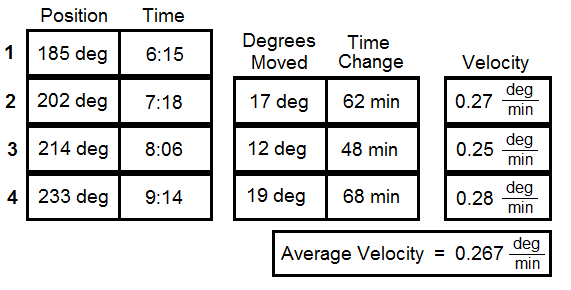 The Velocity is calculated by dividing degrees moved by time change – here we divide 17 / 62 = 0.27 degrees per minute. Finding similar values in the last column every time gives us confidence that we have made good measurements.
Remember: if you chart data taken over a single evening, you are measuring the speed at which the Earth spins. If you chart data taken over several nights, plotting the position of the Moon at the same time each night, then you are measuring the orbital speed of the Moon!
Following Up
Whatever the age level or math level of your students, every one of them can observe the Moon moving in the sky. Watching the Moon sink slowly into the west on a clear night a few days after the new moon can be very gratifying. Students will notice that not only does the Moon move westward, but so do bright stars in the sky. This is observing the rotation of the Earth.
When students later observe the Moon several nights in succession, looking at the same time each night, they will notice something different. Unlike the stars which start out in roughly the same position each night, the Moon begins in a different position each night! When we observe this, we are seeing the Moon moving in orbit around the Earth.