
5.5: Mapping the Constellations


- Last updated
- Nov 1, 2022
- Save as PDF

( \newcommand{\kernel}{\mathrm{null}\,}\)
One of the most fundamental activities of science – and exploration – is to record what we see. Map making is perhaps the oldest expression of this human need to record what we know and share it with others; it long predates other scientific activities and even predates written language.
When we want to make a map of a place where we live, such as our school neighborhood, or even make a map of a place we have been to, such as a summer vacation spot, that may be one thing. How do make a map of a place so far away we can never possibly go there? How do we make a map of the stars? Fortunately, this is not as hard as it sounds! Once again, science extends our reach and allows our minds to go where our bodies could not possibly follow.
The device that we will build is called a pantograph. This device is based upon an old-fashioned drawing tool that allowed the user to copy down drawings and make them different sizes without distortions. We will use our pantograph to accurately copy the constellation patterns that we see in the sky. All we need to do is measure distances between points with a ruler, and copy down angles!
Science and Engineering Practices
- Planning and carrying out investigations.
- Analyzing and interpreting data.
- Using mathematics.
- Obtain, evaluate, and communicate information.
Crosscutting Concepts
- Patterns in nature.
- Stability and change.
Next Generation Science Standards
- Earth’s place in the Universe.
- Motion and Stability.
For the Educator:
Facts you need to know
- Seeing patterns of stars (constellations) and naming them is an ancient activity. We have evidence recorded in clay tablets over 15,000 years old documenting and naming star patterns. Almost every ancient and modern culture has done this.
- The sky has 88 modern constellations that cover the entire visible sky the way states or countries cover a map – there is no space between them.
- From the continental United States and most of Europe, we can see about 65 constellations – those constellations that lie closer to the southern celestial pole are visible only to those who live in the southern hemisphere.
Teaching and Pedagogy
While very young students may have difficulty with the manual dexterity needed for this activity, older children between grades 3-6 should be able to handle it easily. Once again we see that simple methods can produce beautiful and accurate results. This lab activity will also underscore the idea that observing and recording what you see in an accurate way is a definite skill. It is not always easy to determine which students in your class will be the most skillful at this sort of work, the results may surprise you!
For your students, the idea that they can make beautiful and accurate maps of constellations without a camera or a telescope may amaze them. This method is actually an example of 16th century technology that was used by Danish astronomer TychoBrahe (Tee’‑kō Bra’-hey).
Tycho is considered by many to have been the greatest observer in history, without the use of a telescope or camera, he mapped the positions of the stars and planets so accurately that their positions were known to an accuracy of 1/5000th of a degree! These measurements were used years later by his assistant, German astronomer Johannes Kepler to prove that the planets orbited the Sun in elliptical paths instead of circular ones.
Student Outcomes:
What will the student discover?
- Human beings are very good at recognizing patterns in Nature, for millions of years our survival depended upon it. Humans are so good at finding patterns, that we tend to see them even when they are not there; anyone who has played the “What does that cloud look like?” game has seen this pattern recognition ability in action.
- Constellations are patterns we see in the stars. Different cultures recognize different objects when looking at the same stars. The constellation pattern we call the ‘Big Dipper’ in America is called ‘The Plough’ in Britain, and ‘The Ax’ by some Native American cultures.
- Part of discovery is the naming process. A biologist who discovers a new species of beetle, an astronomer who discovers a new asteroid, all discoverers are granted the privilege of naming their discoveries. When children discover and record a new pattern of stars, they can name their discovery, too.
What will your students learn about science?
- The first task of any scientist is to observe accurately and record what they see. Accurately recording the positions of things you see relative to one another creates a map – perhaps the oldest and most fundamental type of scientific model! Astronomers from many cultures around the world have been making maps of constellations to help them create calendars and predict the changing of the seasons for many thousands of years.
- We have evidence of constellation maps recorded in clay tablets from ancient Persia that are more than 15,000 years old. Many scientists believe that structures such as Stonehenge were actually maps and calendar measuring devices made of wood and stone that helped pre-historic mankind mark the constellations and measure the changing of the seasons.
- Scientific models, whether we build them physically, create them on paper, or record them in the language of mathematics all serve to help us understand the world we live in. Learning to create these scientific models in any form can be a valuable job skill – and an exciting career!
Conducting the Activity
Materials
- Two flat, wooden classroom rulers for each student, marked in centimeters
- One 3/16 x ½ bolt and a lock washer and wingnut to match for each student (The local home improvement center can easily help you with this!)
- Electric drill with 3/16 – ¼ inch drill bit
- 6 pieces of large butcher paper or craft paper, each appx. 30” x 48”
- Construction paper, pencils, markers
Building the Pantograph:
- [Teacher] Use the butcher paper and draw six constellations on paper and label them. This works well if you use well-known and recognizable constellations such as Ursa Major (The Big Dipper), Orion (The Hunter), Gemini (The Twins), etc. Draw in the brightest stars (make the dots large – 1” or better) and connect them with clear lines drawn in with a heavy marker. Place these constellation diagrams around the room well up on your classroom walls where they can be easily seen. If you haven’t much wall space in your classroom, these often work well when posted in the hallways or even outside the classroom on the building wall.
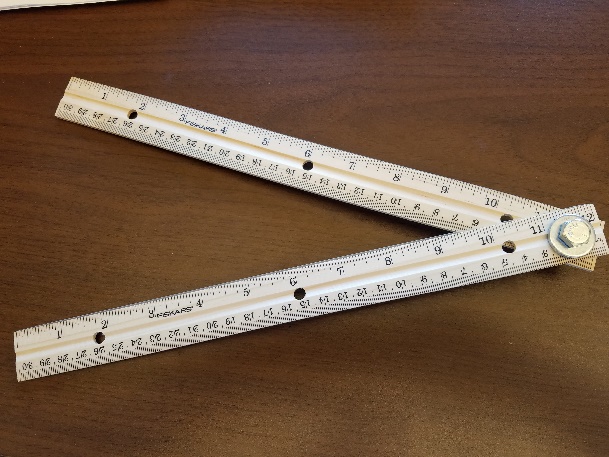 [Teacher] Now you must attach two rulers together using the bolt and wingnut. Some rulers come with holes near one end, if yours do not have this you will have to drill the holes. Rubber band two rulers together and drill a hole about ¾ inch from one end – be sure you have a block of wood behind the rulers as you drill to keep from marring your classroom tables! If you are really on a budget, try using cheap yardsticks from the paint department at the home improvement store – each one can be cut into three inexpensive, 12-inch rulers!
- With the hole drilled, slip the bolt through the hole and secure the rulers together using the wingnut. This needn’t be over tight, students must be able to slide the rulers apart to form an angle. If the rulers slide too easily, try putting a piece of stick-on felt between the rulers for added friction. These two rulers form a simple pantograph, a device for copying shapes and angles precisely.
Using the Pantograph to Record Constellations:
- To copy and map a constellation, we need only look at three stars at a time. Any three stars will form an angle, with the center star at the vertex of the angle. Let’s take the Big Dipper as an example, see figure below.
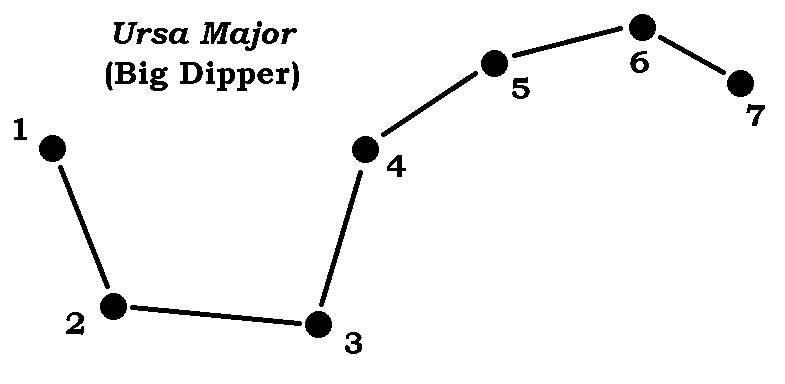
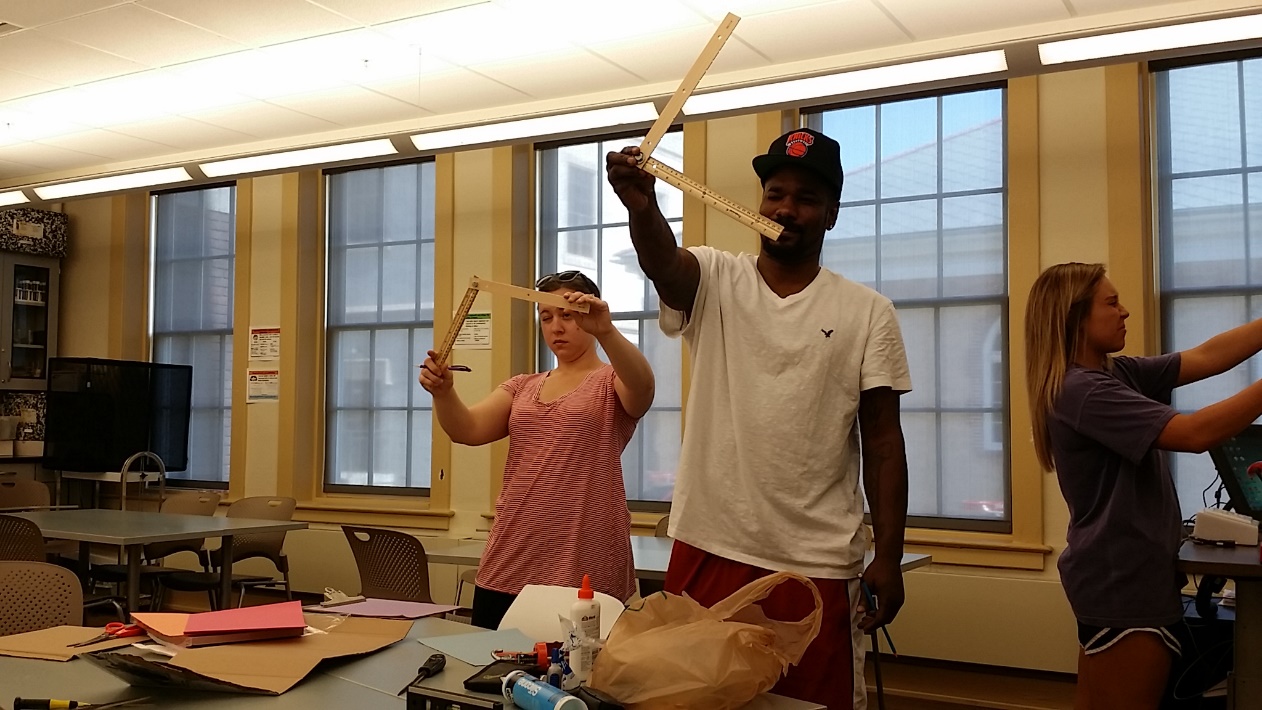
2. Have your student stand 8-10 feet back from your Big Dipper poster – have them hold their rulers at arm’s length, if the line between stars #1 and #2 appears to be 4-6 cm long, they are at the right distance. (You can try this yourself to help them!)
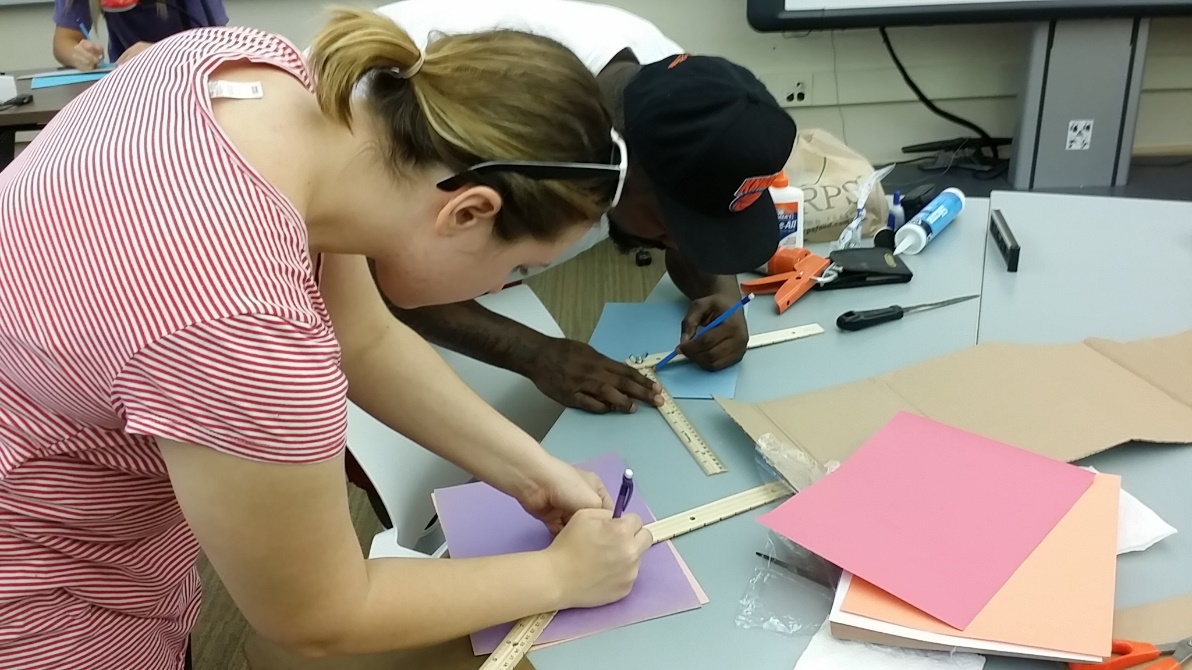
3. Now adjust the two rulers so that star #2 is at the center, and they can measure the distance to the other two stars simultaneously. Now without adjusting the angle between the rulers, transfer the measurements to a piece of construction paper.
 4. Next measure the angle and distance between stars #2 – #3 – #4. Transfer this angle and distance to your paper, which adds star #4 to your map. Continue to proceed along the diagram until you have measured and mapped all seven stars in the constellation.
Discussion Questions
- We have some constellation maps that are over 15,000 years old! How do you think those ancient people made these constellation maps?
- Answer: The most ancient constellation maps were etched into clay slabs and then fired to make a permanent record. These astronomers probably sketched what they saw as an artist would. By the 1300’s, astronomers were using methods very much like those you just used! Modern astronomers use photographs from telescopes and satellites and even computer software to help them make even more accurate maps!
- What else could you use this mapping method for?
- Answer: Interestingly, this method is based upon the pantograph – a device that allows an artist or illustrator to copy a drawing and even change its size in a precise way. Your star-mapping device can be used to map any object where there are distinctive points. Try mapping a school building! Just remember to number the points and measure them in ordered sequence one after the other!
Supplemental Materials
Going Deeper
Most constellations have a connection to mythology, the constellations of the Zodiac are good examples of this. Look at a star map and pick a constellation that interest your students. Try doing an internet search or looking in a book of myths and legends to see if you can find more information about what the constellation is supposed to represent.
Being an Astronomer:
If your students have had good success with mapping constellations on the walls of your classroom, it is now time for them to try the same activity at night with a real constellation. It will not matter which constellation they choose, and in fact, students often have trouble picking out the constellations unless there is someone knowledgeable there to help them!
Lack of constellation knowledge won’t matter a bit – constellations are just arbitrary patterns chosen by people anyway. Any group of bright stars your students choose can easily be measured and recorded accurately on a piece of paper from their back yard. Have your students bring their results back to the classroom. If the children do not know the name of the constellation – have them make one up and tell everyone what these constellation represent to them. Hang these masterworks on your classroom walls for everyone to enjoy!
Being a Scientist:
When you use your pantograph to map a constellation, you should be holding the device at arm’s length to make sure the constellation will fit on a single sheet of drawing or construction paper.
After you have drawn the constellation, use a ruler to measure the distance between the stars in centimeters – write the length down on the lines defining your constellation. The reason that we do this is simple, at arm’s length (57.2 cm to be precise) one centimeter of length also measures one degree of arc. This is called angular distance, and it is the way that we measure size of, and distance between, objects in the sky.
How large are your constellations? If you measure the distance from the center of one constellation to the next with a ruler at night, how far apart are they? Keep in mind that the sky is 180 degrees wide from horizon to horizon; this will give you a better idea of how large the constellations are compared to each other, and compared to the size of the entire sky.
Following Up:
We assume the stars are unchanging, but in fact they are not. The constellations that we see in the sky start each night about 1 degree farther west. The result is that over a period of months, we see different constellations when we go outdoors after sunset.
Programs such as Stellarium (free star-mapping software from www.stellarium.org) show us star maps for the sky any night of the year, and for any location on Earth. You can use such software to see how the constellations change from month to month.
Set up the Stellarium software (or any night sky mapping software) to show the evening sky for today’s date. Then use the calendar function to advance the date one month at a time. You will notice that the April sky in springtime looks little like the summer sky in July, or the autumn sky in October.
Keep an eye on your own sky at night and watch the constellations change from month to month. You will say goodbye to old friends as they sink in the west and welcome new constellations as they rise out of the east as the seasons go by!
- To be mathematically precise, holding a ruler 57.2 cm away from your eye will make 1 cm subtend an angle of exactly 1o – and this corresponds nicely with the length of the average adult human arm. Children’s arms are significantly shorter, so the angle measure will be inaccurate in an absolute scientific sense. It is the concept of measuring angles and the technique of using a ruler to measure them that we are interested in here however, not whether or not a 2nd grader is taking technically precise scientific data for an experiment! ↵
- Keep in mind that metal distorts a compass! Compasses often will not work properly on a desktop because the metal supports beneath the desk will interfere and throw off the reading – this is why we hold the compass in our hands when using it to take a bearing ↵
- This book is written for teachers and students in the northern hemisphere. If you are teaching in the southern hemisphere, the situation will be reversed. The summer moon rides very high above the northern horizon, while the winter Moon stays closer to the northern horizon as it crosses the sky. ↵