
3.1: Designing Telescopes Across the Spectrum


- Last updated
- Mar 2, 2023
- Save as PDF

( \newcommand{\kernel}{\mathrm{null}\,}\)
Three students are discussing a recent trip to the dentist’s office.
- Jason: “The dentist must have x-ray vision to see what is going on in my mouth. I have a lot of cavities.”
- Keisha: “No one really has x-ray vision. The dentist takes an x-ray of your mouth by putting film or a digital camera inside your mouth and then shooting a beam of x-rays through your teeth onto the film.”
- Mark: “Well then, how does Superman see through things?”
Login with LibreOne to view this question
NOTE: If you typically access ADAPT assignments through an LMS like Canvas, you should open this page there.
Login with LibreOne to view this question
NOTE: If you typically access ADAPT assignments through an LMS like Canvas, you should open this page there.
Login with LibreOne to view this question
NOTE: If you typically access ADAPT assignments through an LMS like Canvas, you should open this page there.
As we have seen, there are many kinds of light across the electromagnetic spectrum. Only a tiny portion of this light is what we commonly think of as light; it is the kind that we can see with our eyes (visible light). Furthermore, there are many objects in space that we cannot see despite the fact that they emit visible light. They are just too faint. We deal with the limitations of our eyes by building telescopes and light detectors. These tools, like many of the tools we build, help us expand our physical capabilities beyond what is possible by our bodies alone. In this section, we look at telescopes, our “eyes on the sky.” Our purpose is to illustrate how different telescopes are used, as well as some of the physical limitations on their use.
Magnification is Not Important
Most terrestrial telescopes (or binoculars, which are just paired telescopes mounted such that each eye looks through one of them) are used for magnification. In other words, they are used to make the object you are observing look larger. For instance, birders want to be able to see larger images of the birds they watch so that they can identify the birds and observe their behaviors without having to get so close that they might disturb them. For astronomical telescopes magnification can also be important, but it is not usually of primary concern to astronomers. What is far more important is the ability of telescopes to collect large amounts of light and focus it onto a small area.
Big Telescopes Collect a Lot of Light
If you go out at night in a dark place away from city lights, after taking 20 minutes or so to let your eyes become accustomed to the darkness, you will be able to see 2,000 or 3,000 stars at any given time. Some stars are fairly bright, but most are quite faint. The Milky Way—the galaxy in which we live—contains hundreds of billions of stars, not a few thousand. So why is our view of it so limited? Basically, it is because the sensitivity of our eyes is too feeble to allow us to detect the vast majority of stars—they are simply too faint for us to see. However, if we use even a small telescope or pair of binoculars, the number of stars we can see jumps dramatically, to many tens or even hundreds of thousands. This is the power of astronomical telescopes: They allow us to see fainter objects. And because there are many, many (Many!) more faint objects than bright ones, telescopes reveal multitudes of objects that we could never see with our unaided eyes. As a powerful illustration of this concept, go outside on a dark night and hold your hand out at arm’s length with the fingers spread apart and the palm of your hand pointing away from you. Look at the nail on your smallest finger. If your eyes had the sensitivity of one of today’s large telescopes, you could see that every patch of sky the size of your nail would contain millions of galaxies. In fact, every patch that size does contain them: they are there, but they are just too faint for you to see.
To understand how telescopes are able to reveal faint objects, we need to think a little bit about geometry. The pupil of your eye, when dilated, is perhaps 1 centimeter in diameter. All the light that can be focused on your retina must pass through that small area. On the other hand, even small telescopes, say with a 2-inch lens (about 5 cm diameter) have much more area. The area of a circle is proportional to its diameter squared. That means that a 5-cm telescope has 25 times the area of your eyeball and can therefore collect 25 times more light than your eyes can on their own. A telescope focuses all the light passing through its primary lens into its eyepiece, allowing you to see an amplified (brighter) version of whatever you are viewing.
Mathematically, the relationship between the collecting area (A) and the radius (r) of the instrument is roughly given by a well-known equation.
A=πr2
Since the radius is half of the diameter (D), you can also use this alternative form.
A=π(D2)2
This means that the collecting is proportional to the diameter of the telescope squared.
For this activity, you will determine how the light collecting area of an instrument depends on its size, from the human eye to several well-known telescopes.
You can use the slider to see how the collecting area changes as the diameter changes.
What is the collecting area of a 2-m telescope?
Solution
- Given: diameter D=2m
- Find: area A
- Concept: A=π(D/2)2
- Solution: A=(3.14)(1m)2=3.14m2
- Check: using the slider and setting the diameter to 2m, we also find that the area is 3.14m2
1. What is the collecting area of a 1-m telescope?
- Given: diameter D=1m
- Find: area A
- Concept: A=π(D/2)2
- Solution: A=(3.14)(0.5m)2=0.79m2
2. How much more light does a 10-m telescope, like the Keck Telescope in Hawaii, collect than a human eye (in darkness)?
- Given: DKeck = 10 m (diameter of Keck), Deye = 0.01 m (diameter of pupil)
- Find: ratio of areas: AKeck/Aeye
- Concept(s): A proportional to D2
- Solution: AKeck/Aeye = (10)2/(0.01)2 = 106
- ⇒ Keck collects about 1 million times more light than a human eye collects.
How many times bigger is the collecting area of the 2-m telescope than a 1-m telescope?
Solution
- Either you can take the ratio of the areas found from using the slider tool, or you can use the concept that the area goes as the diameter squared. Both methods give an answer of the larger telescope collecting 4 times more light.
- Method 1: area of 2-m telescope / area of 1-meter telescope = 3.14/0.79 = 4
- Method 2: ratio of areas is the square of the ratio of diameters: (2/1)2 = 4
Login with LibreOne to view this question
NOTE: If you typically access ADAPT assignments through an LMS like Canvas, you should open this page there.
Login with LibreOne to view this question
NOTE: If you typically access ADAPT assignments through an LMS like Canvas, you should open this page there.
Login with LibreOne to view this question
NOTE: If you typically access ADAPT assignments through an LMS like Canvas, you should open this page there.
Resolution
Another advantage telescopes have over our eyes is their ability to distinguish small details. This property is called resolution.
Think about the smallest detail you can see. If you have typical eyes that do not require correction with glasses, then that detail has an angular size of about 1 arcminute. Notice we are talking about angular size, not actual size. This is because as we change our distance from an object, its physical size will not change, but its apparent size, that is, the angle it subtends, will become smaller if the object moves away and bigger if the object moves closer. Resolution is a measure of angular size.
Before we continue, we have to define what exactly we mean by an arcminute. You probably already know that a circle contains 360 degrees. Each degree contains 60 arcminutes, so if you imagine dividing the circle angle into 360 equal pie-wedge pieces, and then you further divide one of those wedges into 60 equal pieces, that is an arcminute. The arcminutes can be further subdivided into 60 equal parts called arcseconds—it works just like time. So 1 degree contains 3,600 arcseconds (just as 1 hour contains 3,600 seconds). Perhaps this is not an easy thing to visualize. Some examples might be in order.
The full moon subtends an angle of about half a degree, or 30 arcminutes. A person who looks at the Moon can discern details as small as about 1/30th the diameter of the Moon—an arcminute.
If we use a telescope, we can distinguish much smaller details than that. This is due to two effects. The most obvious effect is that the telescope magnifies the image of the Moon causing the objects that subtend only one arcminute to our bare eyes to grow to subtend perhaps 30 or more arcminutes in the image we see in the telescope. However, if we used a telescope with a diameter no larger than our eyes’ diameter, all we would see would be a large blurry image. The telescope would magnify the scene, but it would still not show any details smaller than those visible to our eyes alone. This is one consequence of the wavelike properties of light.
As with light gathering power, a major advantage of a telescope is not its ability to magnify. Rather, it is the larger diameter of its primary lens. The larger the diameter allows the telescope to clearly discern smaller details - smaller in angular size, not necessarily absolute physical size. We say it is able to resolve these smaller details. This is the result of light diffraction, or the bending and interference of light waves in the telescope. The resolution of a telescope is proportional to the ratio of the wavelength of the light it collects and the diameter of the telescope’s lens.
θ=1.22λD
the angle, θ is the smallest angle resolvable, λ is the wavelength of the light, and D is the diameter of the telescope. From the expression, you can see that as long as the ratio of the wavelength to the diameter is small, the resolution of the telescope will be good (i.e., the telescope will be able to discern very small details). To use this equation, the angle θ must be in radians, not degrees. Radians are a unit of angular measure derived from working with circles: 1 radian = 57.3 degrees because there are 2π radians = 360 degrees in a full circle.
In this activity, you will predict the number of astronomical objects that make up the blurred image that you see in the window.
You can use the sliders to adjust the diameter (D) of the primary mirror of the telescope being used. You can also adjust the wavelength of light (\lambda\) emitted from the object.
Without proper resolution, astronomers cannot see the finer details in an image. Keep in mind that the resolution is best when the angle θ, which depends on the ratio of λ/D, is small. (You will not need to perform any calculations. The activity is designed to promote understanding of the concept behind resolution, not test your skills in arithmetic.)
1. Keep track of your predictions as you go through the activity. Complete at least three different trials or more until you get at least one correct. Record the positions of the wavelength and diameter sliders when the best resolution is reached for each trial below. State the number of objects that became visible and whether or not each of your predictions was correct.
Example:
Login with LibreOne to view this question
NOTE: If you typically access ADAPT assignments through an LMS like Canvas, you should open this page there.
Login with LibreOne to view this question
NOTE: If you typically access ADAPT assignments through an LMS like Canvas, you should open this page there.
In the following activity, you will calculate the resolution for several different telescopes.
Worked Example
1. What resolution is obtainable by a 1-m diameter telescope observing visible light of wavelength 500 nm (green light)? Express your answer as an angle in arcseconds.
- Given: λ = 500 nm = 500E-9 m; D = 1 m
- Find: θ
- Concept(s): θ=1.22(λD)
- Solution: θ= 1.22 (500E-9 m)/(1 m) = 6.1E-7 radians
The expression gives us the angle in radians, but we would like to have it in arcseconds. Knowing that there are π (roughly 3.14) radians in 180 degrees, and that there are 3,600 arcseconds in each degree, we can convert our angle to arcseconds as follows:
θ=(6.1E-7radians)(180degreesπradians)(3600arcsec1degree)=0.13arcsec
This is a very small angle, much too small to been seen by the eye alone.
Questions:
Login with LibreOne to view this question
NOTE: If you typically access ADAPT assignments through an LMS like Canvas, you should open this page there.
Login with LibreOne to view this question
NOTE: If you typically access ADAPT assignments through an LMS like Canvas, you should open this page there.
Login with LibreOne to view this question
NOTE: If you typically access ADAPT assignments through an LMS like Canvas, you should open this page there.
Field of View
The field of view (FOV) is the total area that can be seen through the eyepiece of a telescope. For a camera, it is the angular size of the area that a camera can image at any given time. Our eyes also have a field of view, often called the field of vision. The field of view varies for different instruments, such as different size telescopes, binoculars, and the eyes of different animals (humans included). The area that is covered by a field of vision is described by an angle. For a telescope, the FOV is so small that it is typically measured in arcminutes or arcseconds. Examples of some typical fields of view are listed in the following chart.
| OPTICAL INSTRUMENT | FIELD OF VIEW |
|---|---|
| A Human Eye | ~180° |
| A Horse’s Eye | ~200° |
| Binoculars (10 x 50) | ~5° |
| Small Amateur Telescope | ~1.5° |
| The Hubble Telescope’s Wide Field Camera 3 | 164 × 164 arcseconds |
Capturing the Light With Detectors
In addition to collecting and focusing much more light than an eyeball, telescopes have another advantage; most of them do not use our eyes as a detector. Instead, a sensitive electronic instrument is placed where the eyepiece would go. This has several advantages. The first is efficiency. While our eyes only capture a small percent of the photons that enter them, modern detectors of visible light are more than 90 percent efficient. A second advantage of telescopes and detectors is time of exposure. Our eyes only collect photons for a fraction of a second before dumping the data and starting over. This is good if we want to see our environment change in real time. It is not good if we want to do astronomy. Most astronomical objects do not change much over timescales of seconds or minutes (or sometimes even millennia!), so it is advantageous to simply stare at them and collect photons for many seconds, minutes, hours, or even days. This is what the electronic “eyes” —detectors—we put on telescopes can do. They are able to stare at an object for as long as we like, building up an image until even extremely faint objects begin to show themselves. A final huge advantage is that with electronic cameras we can store any images we collect and look at them later. Much, much later if we like: we still have photographic plates of the sky from the end of the 19th century that can be referred to if the need arises.
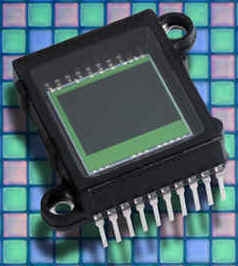
Modern detectors for visible light are not photographic film. They consist of semiconductor crystals (mostly silicon) that turn incoming photons into electrical charge. The charge can then be read off by electronics to determine how much light has hit the detector. These sorts of detectors are called Charge-Coupled Devices (or CCDs for short) or Complimentary Metal Oxide Semiconductors (CMOS). Consumer level digital cameras in common use by photographers, as well as those found in cell phones, are made with CMOS light detectors. For the most part, CCDs are used only for scientific applications, including astronomy. Both types of detectors can be used for detecting IR, UV, and low-energy x-ray light, not just visible light. An example of a CCD chip is shown in Figure 3.1. A CMOS detector would look essentially the same.
Using CCDs and CMOS sensors to detect light has one major disadvantage: the detectors are not able to distinguish different wavelengths of light; that is, they are like black-and-white film; they record only intensity, not color. To get around this problem, astronomers have developed systems of color filters that can be placed in front of the camera, thereby providing some crude spectral information about objects within the images. These filters were originally created to be used with black-and-white film, but they can be used with modern CCDs as well. If one wishes, a color image can be created by collecting images through each of the filters and then combining them into a single image with software. Consumer cameras perform this task by mounting a pattern of similar color filters permanently in front of the sensor. This technique allows color information to be collected in a single exposure, though at the cost of poorer angular resolution.
When astronomers make an image of an object (using visible light), they almost always take the image through one of the standard filters. And as mentioned, any color images we see in the news are made by combining several images, usually at least three, taken with a different filter. If we use filters that all fall in the visible part of the spectrum, then the different colors can be combined so as to give a composite image that corresponds roughly to what our eye might see, if only it had the sensitivity of the telescope/CCD combination. However, for images taken with IR or UV filters, the colors are arbitrarily assigned, usually to highlight different parts of the object with different chemical composition or other properties. These non-visible forms of light have no colors of their own, naturally.
The detectors used for x-ray, gamma-ray, and radio telescopes are inherently sensitive to the energy (or wavelength of frequency) of the light they detect, not just its intensity. As a result, it is not necessary to use filters for those kinds of telescopes.
Different Telescopes and Detectors for Different Wavelengths of Light
Telescopes help us see faint objects in optical light, but what about the other kinds of light? Might there be something of interest going on in other parts of the spectrum? The answer to this question is yes! But that was not always obvious. In fact, only slowly did scientists come to understand that celestial objects can be a source of light across the electromagnetic spectrum, all the way from radio waves to gamma-rays.
The earliest evidence for non-visible radiation from the cosmos came in the early 1930s. At that time, an engineer named Karl Jansky (1905 – 1950), working at the AT&T Bell Labs, was attempting to track down sources of radio interference that might compromise the new systems of radio communication then being developed (Figure 3.2). Engineers expected that lightning storms might degrade their radio signals. Jansky was attempting to characterize such noise - scientists refer to any such interference that interferes with their signals as "noise." He did find the anticipated noise, but he also found something else: a source of static that tracked across the sky with the stars as Earth rotated. At first, he thought it must come from the Sun. Upon further study, he discovered that the noise came from the Milky Way. This discovery, reported in 1933, was largely ignored by astronomers; they were all focused on visible light.
The first person to follow up on Jansky’s discovery was Grote Reber (1911 – 2002), a radio engineer from the suburbs of Chicago. Reber built a radio telescope in his backyard to systematically survey the sky in radio waves. Despite its modest beginnings, radio astronomy has grown to become a vital part of astrophysics. The sky is now known to be bright with radio emission at many different radio frequencies and coming from many sources, not just the Milky Way.

The beginnings of x-ray astronomy are similar to those of radio astronomy, though they came several decades later. Most astronomers were still focusing their attention on optical wavelengths. They did not think that cosmic sources of x-rays other than the Sun would even be visible. Despite this, in 1962, a team of scientists led by Riccardo Giacconi launched an x-ray detector on a rocket above Earth’s atmosphere, purportedly in an effort to detect fluorescence from solar x-rays on the Moon’s surface. Actually, what Giacconi’s team at American Science and Engineering really wanted to learn about was what sorts of then-unknown astrophysical sources might emit x-rays. Since that was a more difficult argument to make to the agencies that funded their efforts, they justified their efforts with lunar x-ray fluorescence. However, they found something much more interesting: cosmic x-ray sources well away from our solar system.
As a result of the success in discovering the first extra-solar x-ray source (called Sco X-1, located in the constellation Scorpius), many other rocket flights occurred into the 1960s, and many more x-ray sources were discovered. (Giacconi would receive the Nobel Prize in physics in 2002 for his “discovery of cosmic x-ray sources.”) The team also built a NASA satellite known as Uhuru. Uhuru (which means “freedom” in Swahili) was launched from an offshore platform near the coast of Kenya in 1970. The launch occurred on Kenyan Independence Day (Figure 3.3). Uhuru did the first complete survey of the sky in x-rays and discovered many sources outside of the Galaxy. Some of the new x-ray sources corresponded to known radio or optical sources. Others did not.

An interesting problem in the early days of x-ray and radio astronomy was in correlating the sources that were seen in radio, x-ray, and visible light. Almost none of the new sources discovered, either in radio or x-rays, were the stars that dominate the night sky in optical light. Sometimes, visible counterparts to the sources could be found, and often, these turned out to be galaxies. Sometimes, they appeared to be normal-looking stars, but astronomers suspected that something else might be there. Stars do not emit x-rays or radio waves in the amounts these new sources did. Some of the sources had no visible-light counterparts at all, and so they remained a complete mystery.
The field of astrophysics has undergone a revolution as new energy bands have been explored. It has become clear that if we want to have a complete view of the Universe, we must be able to observe it in all available wavelengths of radiation. Multi-wavelength astronomy, as it is now called, is incredibly powerful, because it allows us to probe a wide range of physical processes going on within astronomical objects. It has even led to the discovery of entirely new types of astronomical objects. Not only can we look at individual objects in multiple wavelengths, but we have also done surveys of the entire sky in all bands of the EM spectrum, as shown in Figures 3.4.


.jpg?revision=1&size=bestfit&width=550&height=366)
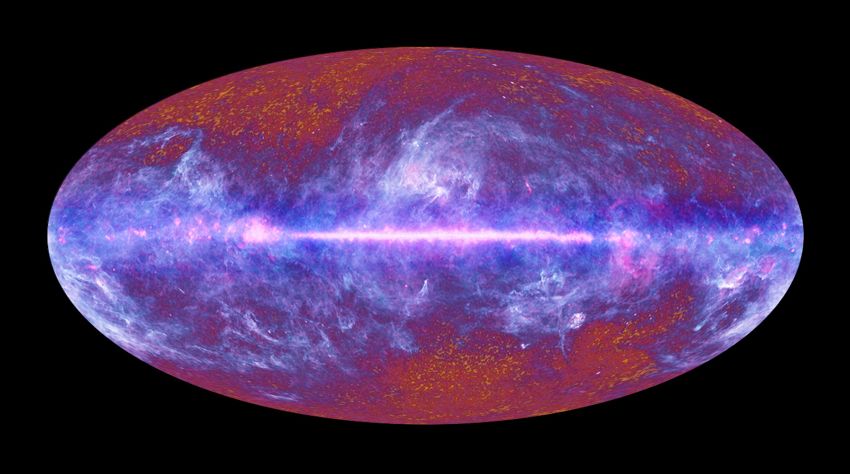.jpg?revision=1&size=bestfit&width=550&height=307)


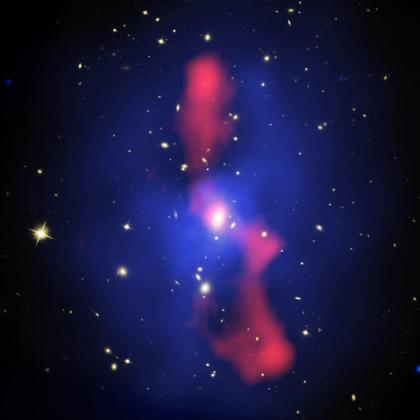
As another example, consider the following images of a cluster of galaxies located about 2.6 billion light years away in the constellation of Camelopardus, shown in Figure 3.6. If we observe in visible light, we see light from the galaxies that is dominated by starlight. The surface temperature of stars corresponds to a peak wavelength of a Planck spectrum in or near the visible wavelengths. However, if we look at the cluster in x-rays, we see hot, diffuse gas between the galaxies, shown as the diffuse blue haze. And, if we look in the radio, we see jets of material shooting out of the cluster. These are the large red blobs in the image.
The technology needed to detect electromagnetic waves of different frequencies and make astronomical measurements is diverse. CCDs and CMOS sensors have become the standard kind of detector for optical observations; they are also used in the infrared, ultraviolet, and low-energy x-ray bands. Radio telescopes typically use very large dishes to focus radio waves onto a radio receiver. Gamma-ray detectors are modeled after those used in particle physics. You will learn about these other types of detectors as you progress through the modules.