
29.5: Atmosphere
- Page ID
- 28118
\( \newcommand{\vecs}[1]{\overset { \scriptstyle \rightharpoonup} {\mathbf{#1}} } \)
\( \newcommand{\vecd}[1]{\overset{-\!-\!\rightharpoonup}{\vphantom{a}\smash {#1}}} \)
\( \newcommand{\dsum}{\displaystyle\sum\limits} \)
\( \newcommand{\dint}{\displaystyle\int\limits} \)
\( \newcommand{\dlim}{\displaystyle\lim\limits} \)
\( \newcommand{\id}{\mathrm{id}}\) \( \newcommand{\Span}{\mathrm{span}}\)
( \newcommand{\kernel}{\mathrm{null}\,}\) \( \newcommand{\range}{\mathrm{range}\,}\)
\( \newcommand{\RealPart}{\mathrm{Re}}\) \( \newcommand{\ImaginaryPart}{\mathrm{Im}}\)
\( \newcommand{\Argument}{\mathrm{Arg}}\) \( \newcommand{\norm}[1]{\| #1 \|}\)
\( \newcommand{\inner}[2]{\langle #1, #2 \rangle}\)
\( \newcommand{\Span}{\mathrm{span}}\)
\( \newcommand{\id}{\mathrm{id}}\)
\( \newcommand{\Span}{\mathrm{span}}\)
\( \newcommand{\kernel}{\mathrm{null}\,}\)
\( \newcommand{\range}{\mathrm{range}\,}\)
\( \newcommand{\RealPart}{\mathrm{Re}}\)
\( \newcommand{\ImaginaryPart}{\mathrm{Im}}\)
\( \newcommand{\Argument}{\mathrm{Arg}}\)
\( \newcommand{\norm}[1]{\| #1 \|}\)
\( \newcommand{\inner}[2]{\langle #1, #2 \rangle}\)
\( \newcommand{\Span}{\mathrm{span}}\) \( \newcommand{\AA}{\unicode[.8,0]{x212B}}\)
\( \newcommand{\vectorA}[1]{\vec{#1}} % arrow\)
\( \newcommand{\vectorAt}[1]{\vec{\text{#1}}} % arrow\)
\( \newcommand{\vectorB}[1]{\overset { \scriptstyle \rightharpoonup} {\mathbf{#1}} } \)
\( \newcommand{\vectorC}[1]{\textbf{#1}} \)
\( \newcommand{\vectorD}[1]{\overrightarrow{#1}} \)
\( \newcommand{\vectorDt}[1]{\overrightarrow{\text{#1}}} \)
\( \newcommand{\vectE}[1]{\overset{-\!-\!\rightharpoonup}{\vphantom{a}\smash{\mathbf {#1}}}} \)
\( \newcommand{\vecs}[1]{\overset { \scriptstyle \rightharpoonup} {\mathbf{#1}} } \)
\(\newcommand{\longvect}{\overrightarrow}\)
\( \newcommand{\vecd}[1]{\overset{-\!-\!\rightharpoonup}{\vphantom{a}\smash {#1}}} \)
\(\newcommand{\avec}{\mathbf a}\) \(\newcommand{\bvec}{\mathbf b}\) \(\newcommand{\cvec}{\mathbf c}\) \(\newcommand{\dvec}{\mathbf d}\) \(\newcommand{\dtil}{\widetilde{\mathbf d}}\) \(\newcommand{\evec}{\mathbf e}\) \(\newcommand{\fvec}{\mathbf f}\) \(\newcommand{\nvec}{\mathbf n}\) \(\newcommand{\pvec}{\mathbf p}\) \(\newcommand{\qvec}{\mathbf q}\) \(\newcommand{\svec}{\mathbf s}\) \(\newcommand{\tvec}{\mathbf t}\) \(\newcommand{\uvec}{\mathbf u}\) \(\newcommand{\vvec}{\mathbf v}\) \(\newcommand{\wvec}{\mathbf w}\) \(\newcommand{\xvec}{\mathbf x}\) \(\newcommand{\yvec}{\mathbf y}\) \(\newcommand{\zvec}{\mathbf z}\) \(\newcommand{\rvec}{\mathbf r}\) \(\newcommand{\mvec}{\mathbf m}\) \(\newcommand{\zerovec}{\mathbf 0}\) \(\newcommand{\onevec}{\mathbf 1}\) \(\newcommand{\real}{\mathbb R}\) \(\newcommand{\twovec}[2]{\left[\begin{array}{r}#1 \\ #2 \end{array}\right]}\) \(\newcommand{\ctwovec}[2]{\left[\begin{array}{c}#1 \\ #2 \end{array}\right]}\) \(\newcommand{\threevec}[3]{\left[\begin{array}{r}#1 \\ #2 \\ #3 \end{array}\right]}\) \(\newcommand{\cthreevec}[3]{\left[\begin{array}{c}#1 \\ #2 \\ #3 \end{array}\right]}\) \(\newcommand{\fourvec}[4]{\left[\begin{array}{r}#1 \\ #2 \\ #3 \\ #4 \end{array}\right]}\) \(\newcommand{\cfourvec}[4]{\left[\begin{array}{c}#1 \\ #2 \\ #3 \\ #4 \end{array}\right]}\) \(\newcommand{\fivevec}[5]{\left[\begin{array}{r}#1 \\ #2 \\ #3 \\ #4 \\ #5 \\ \end{array}\right]}\) \(\newcommand{\cfivevec}[5]{\left[\begin{array}{c}#1 \\ #2 \\ #3 \\ #4 \\ #5 \\ \end{array}\right]}\) \(\newcommand{\mattwo}[4]{\left[\begin{array}{rr}#1 \amp #2 \\ #3 \amp #4 \\ \end{array}\right]}\) \(\newcommand{\laspan}[1]{\text{Span}\{#1\}}\) \(\newcommand{\bcal}{\cal B}\) \(\newcommand{\ccal}{\cal C}\) \(\newcommand{\scal}{\cal S}\) \(\newcommand{\wcal}{\cal W}\) \(\newcommand{\ecal}{\cal E}\) \(\newcommand{\coords}[2]{\left\{#1\right\}_{#2}}\) \(\newcommand{\gray}[1]{\color{gray}{#1}}\) \(\newcommand{\lgray}[1]{\color{lightgray}{#1}}\) \(\newcommand{\rank}{\operatorname{rank}}\) \(\newcommand{\row}{\text{Row}}\) \(\newcommand{\col}{\text{Col}}\) \(\renewcommand{\row}{\text{Row}}\) \(\newcommand{\nul}{\text{Nul}}\) \(\newcommand{\var}{\text{Var}}\) \(\newcommand{\corr}{\text{corr}}\) \(\newcommand{\len}[1]{\left|#1\right|}\) \(\newcommand{\bbar}{\overline{\bvec}}\) \(\newcommand{\bhat}{\widehat{\bvec}}\) \(\newcommand{\bperp}{\bvec^\perp}\) \(\newcommand{\xhat}{\widehat{\xvec}}\) \(\newcommand{\vhat}{\widehat{\vvec}}\) \(\newcommand{\uhat}{\widehat{\uvec}}\) \(\newcommand{\what}{\widehat{\wvec}}\) \(\newcommand{\Sighat}{\widehat{\Sigma}}\) \(\newcommand{\lt}{<}\) \(\newcommand{\gt}{>}\) \(\newcommand{\amp}{&}\) \(\definecolor{fillinmathshade}{gray}{0.9}\)The atmosphere is a very complex dynamic interaction between many different species of atoms and molecules. The average percentage compositions of the eleven most abundant gases in the atmosphere up to an altitude of 25 km are shown in Table 1.
Table 1: Average composition of the atmosphere up to an altitude of 25 km.
| Gas Name | Chemical Formula | Percent Volume |
| Nitrogen | \({N}_{2}\) | 78.08% |
| Oxygen | \({O}_{2}\) | 20.95% |
| *Water | \({H}_{2}O\) | 0 to 4% |
| Argon | \(Ar\) | 0.93% |
| *Carbon Dioxide | \({CO}_{2}\) | 0.0360% |
| Neon | \(Ne\) | 0.0018% |
| Helium | \(He\) | 0.0005% |
| *Methane | \(\mathrm{CH}_{4}\) | 0.00017% |
| Hydrogen | \(H_{2}\) | 0.00005% |
| *Nitrous Oxide | \(\mathrm{N}_{2} \mathrm{O}\) | 0.00003% |
| *Ozone | \(O_{3}\) | 0.000004% |
* variable gases
In the atmosphere, nitrogen forms a diatomic molecule with molar mass \(M_{\mathrm{N}_{2}}=28.0 \mathrm{g} \cdot \mathrm{mol}^{-1}\) and oxygen also forms a diatomic molecule \(O_{2}\) with molar mass \(M_{\mathrm{O}}=32.0 \mathrm{g} \cdot \mathrm{mol}^{-1}\). Since these two gases combine to form 99% of the atmosphere, the O2 average molar mass of the atmosphere is \[M_{\mathrm{atm}} \simeq(0.78)\left(28.0 \mathrm{g} \cdot \mathrm{mol}^{-1}\right)+(0.21)\left(32.0 \mathrm{g} \cdot \mathrm{mol}^{-1}\right)=28.6 \mathrm{g} \cdot \mathrm{mol}^{-1} \nonumber \]
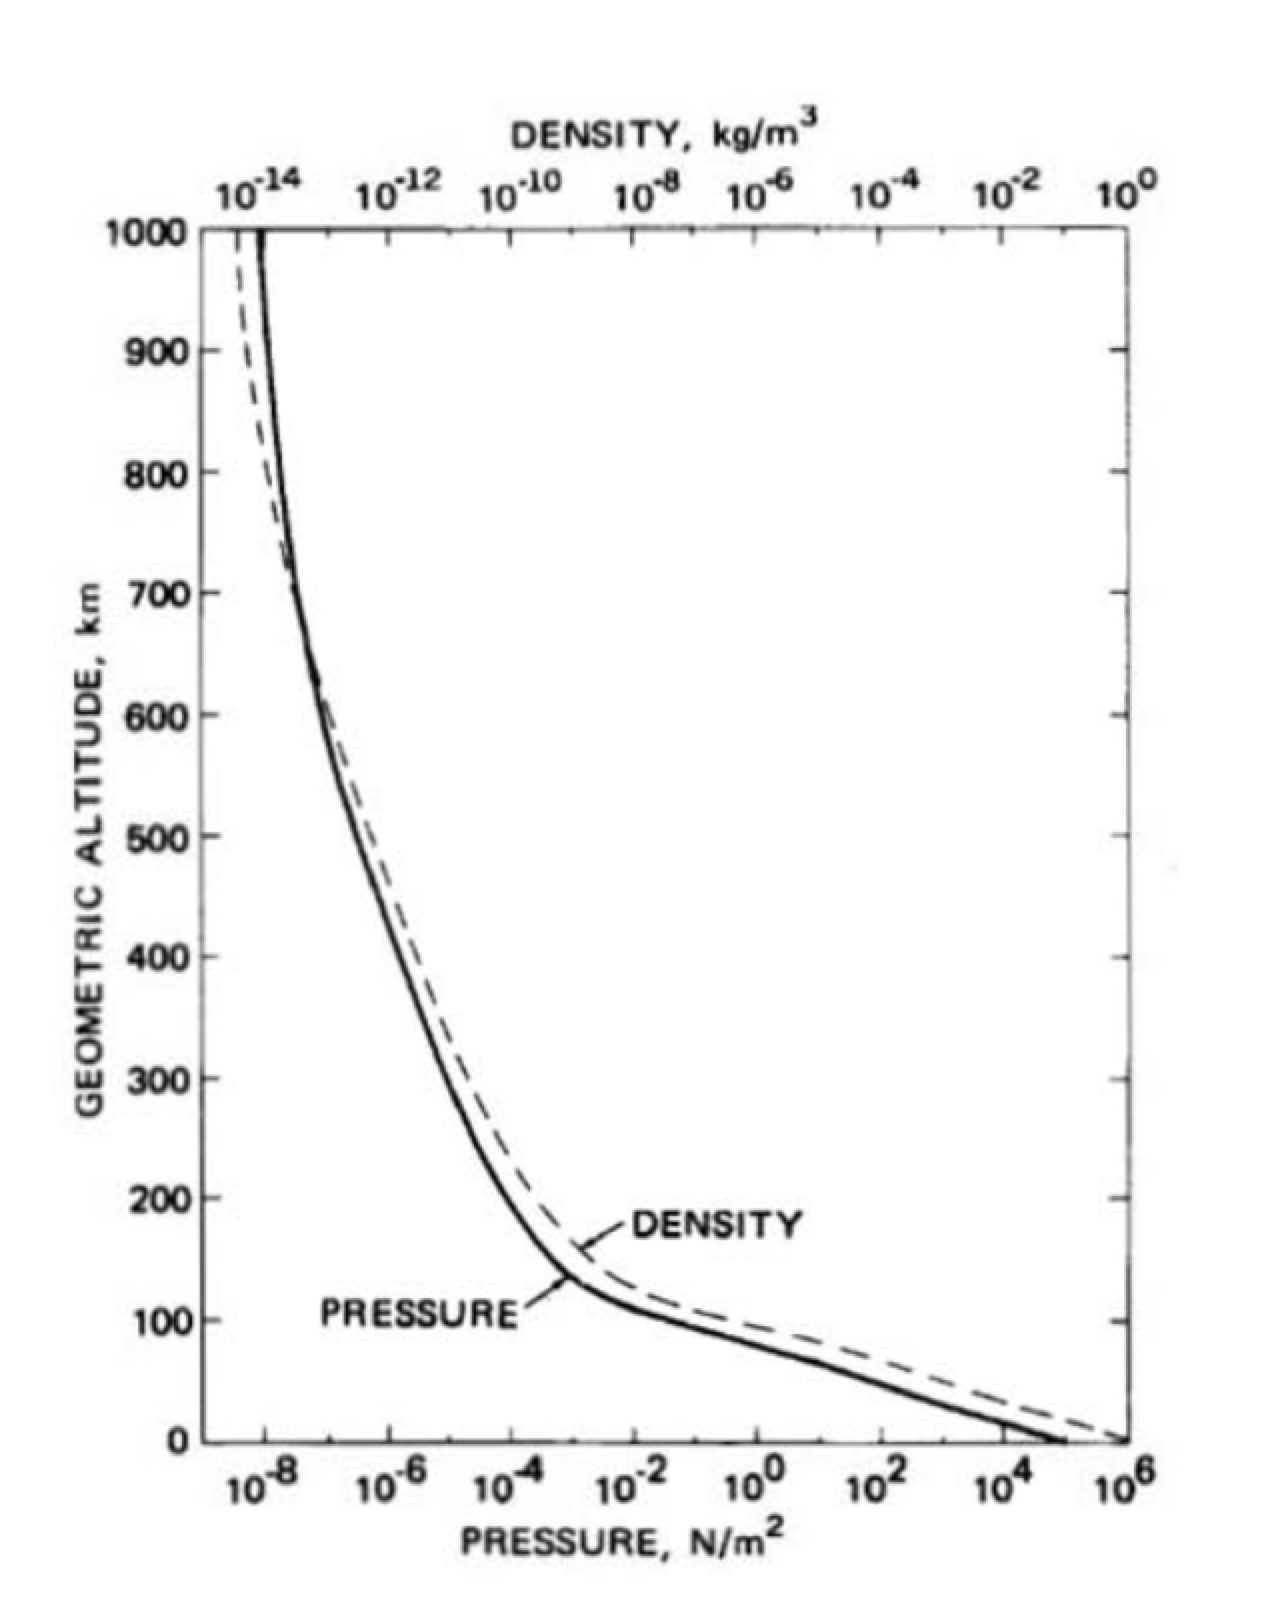
The density \(\rho\) of the atmosphere as a function of molar mass \(M_{\mathrm{atm}}\), the volume V , and atm number of moles \(n_{m}\) contained in the volume is given by \[\rho=\frac{M^{\text {total }}}{V}=\frac{n_{\mathrm{m}} M_{\text {molar }}}{V} \nonumber \] How does the pressure of the atmosphere vary a function of height above the surface of the earth? In Figure 29.4, the height above sea level in kilometers is plotted against the pressure. (Also plotted on the graph as a function of height is the density in kilograms per cubic meter.)
Isothermal Ideal Gas Atmosphere
Let’s model the atmosphere as an ideal gas in static equilibrium at constant temperature \(T=250 \mathrm{K}\). The pressure at the surface of the earth is \(P_{0}=1.02 \times 10^{5} \mathrm{Pa}\). The pressure of an ideal gas, using the ideal gas equation of state (Equation (29.4.23)) can be expressed in terms of the pressure P, the universal gas constant R, molar mass of the atmosphere \(M_{\mathrm{atm}}\), and the temperature T, \[P=n_{\mathrm{m}} R \frac{T}{V}=\frac{M^{\text {total }}}{V} \frac{R T}{M_{\text {atm }}}=\rho \frac{R T}{M_{\text {atm }}} \nonumber \] Thus the equation of state for the density of the gas can be expressed as \[\rho=\frac{M_{\text {atm }}}{R T} P \nonumber \] We use Newton’s Second Law determine the condition on the forces that are acting on a small cylindrical volume of atmosphere (Figure 29.5a) in static equilibrium of cross section area A located between the heights \(z\) and \(z+\Delta z\)
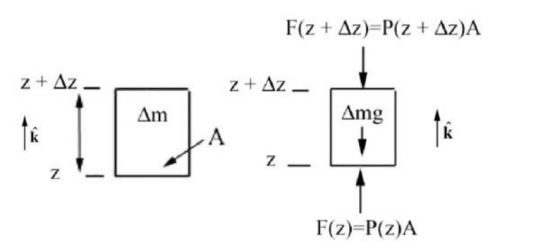
The mass contained in this element is the product of the density \(\rho\) and the volume element \(\Delta V=A \Delta z\), \[\Delta m=\rho \Delta V=\rho A \Delta z \nonumber \]
The force due to the pressure on the top of the cylinder is directed downward and is equal to \(\overrightarrow{\mathbf{F}}(z+\Delta z)=-P(z+\Delta z) A \hat{\mathbf{k}}\) (Figure 29.5(b)) where \(\hat{\mathbf{k}}\) is the unit vector directed upward. The force due to the pressure on the bottom of the cylinder is directed upward and is equal to \(\overrightarrow{\mathbf{F}}(z)=P(z) A \hat{\mathbf{k}}\). The pressure on the top \(P(z+\Delta z)\) and bottom \(P(z)\) of this element are not equal but differ by an amount \(\Delta P=P(z+\Delta z)-P(z)\). The force diagram for this element is shown in the Figure 29.5b.
Because the atmosphere is in static equilibrium in our model, the sum of the forces on the volume element are zero, \[\overrightarrow{\mathbf{F}}^{\text {total }}=\Delta m \overrightarrow{\mathbf{a}}=\overrightarrow{\mathbf{0}} \nonumber \] Thus the condition for static equilibrium of forces in the z -direction is \[-P(z+\Delta z) A+P(z) A-\Delta m g=0 \nonumber \] The change is pressure is then given by \[\Delta P A=-\Delta m g \nonumber \] Using Equation (29.5.5) for the mass Δm , substitute into Equation (29.5.8), yielding \[\Delta P A=-\rho A \Delta z g=-\frac{M_{\mathrm{atm}} g}{R T} A \Delta z P \nonumber \] The derivative of the pressure as a function of height is then linearly proportional to the pressure, \[\frac{d P}{d z}=\lim _{\Delta z \rightarrow 0} \frac{\Delta P}{\Delta z}=-\frac{M_{\text {atm }} g}{R T} P \nonumber \] This is a separable differential equation; separating the variables, \[\frac{d P}{P}=-\frac{M_{\text {atm }} g}{R T} d z \nonumber \] Integrate Equation (29.5.11) to yield \[\int_{P_{0}}^{P(z)} \frac{d P}{P}=\ln \left(\frac{P(z)}{P_{0}}\right)=-\int_{0}^{z} \frac{M_{\text {atm }} g}{R T} d z=-\frac{M_{\text {atm }} g}{R T} z \nonumber \] Exponentiate both sides of Equation (29.5.12) to find the pressure P(z) in the atmosphere as a function of height z above the surface of the earth, \[P(z)=P_{0} \exp \left(-\frac{M_{\mathrm{atm}} g}{R T} z\right) \nonumber \]
Example 29.2 Ideal Gas Atmospheric Pressure
What is the ratio of atmospheric pressure at z = 9.0 km to the atmospheric pressure at the surface of the earth for our ideal-gas atmosphere?
Solution \[\frac{P(9.0 \mathrm{km})}{P_{0}}=\exp \left(-\frac{\left(28.6 \times 10^{-3} \mathrm{kg} \cdot \mathrm{mol}^{-1}\right)\left(9.8 \mathrm{m} \cdot \mathrm{s}^{-2}\right)}{\left(8.31 \mathrm{J} \cdot \mathrm{K}^{-1} \cdot \mathrm{mol}^{-1}\right)(250 \mathrm{K})}\left(9.0 \times 10^{3} \mathrm{m}\right)\right) = 30 \nonumber \]
Earth’s Atmosphere
We made two assumptions about the atmosphere, that the temperature was uniform and that the different gas molecules were uniformly mixed. The actual temperature varies according to the specific region of the atmosphere. A plot of temperature as a function of height is shown in Figure 29.6.
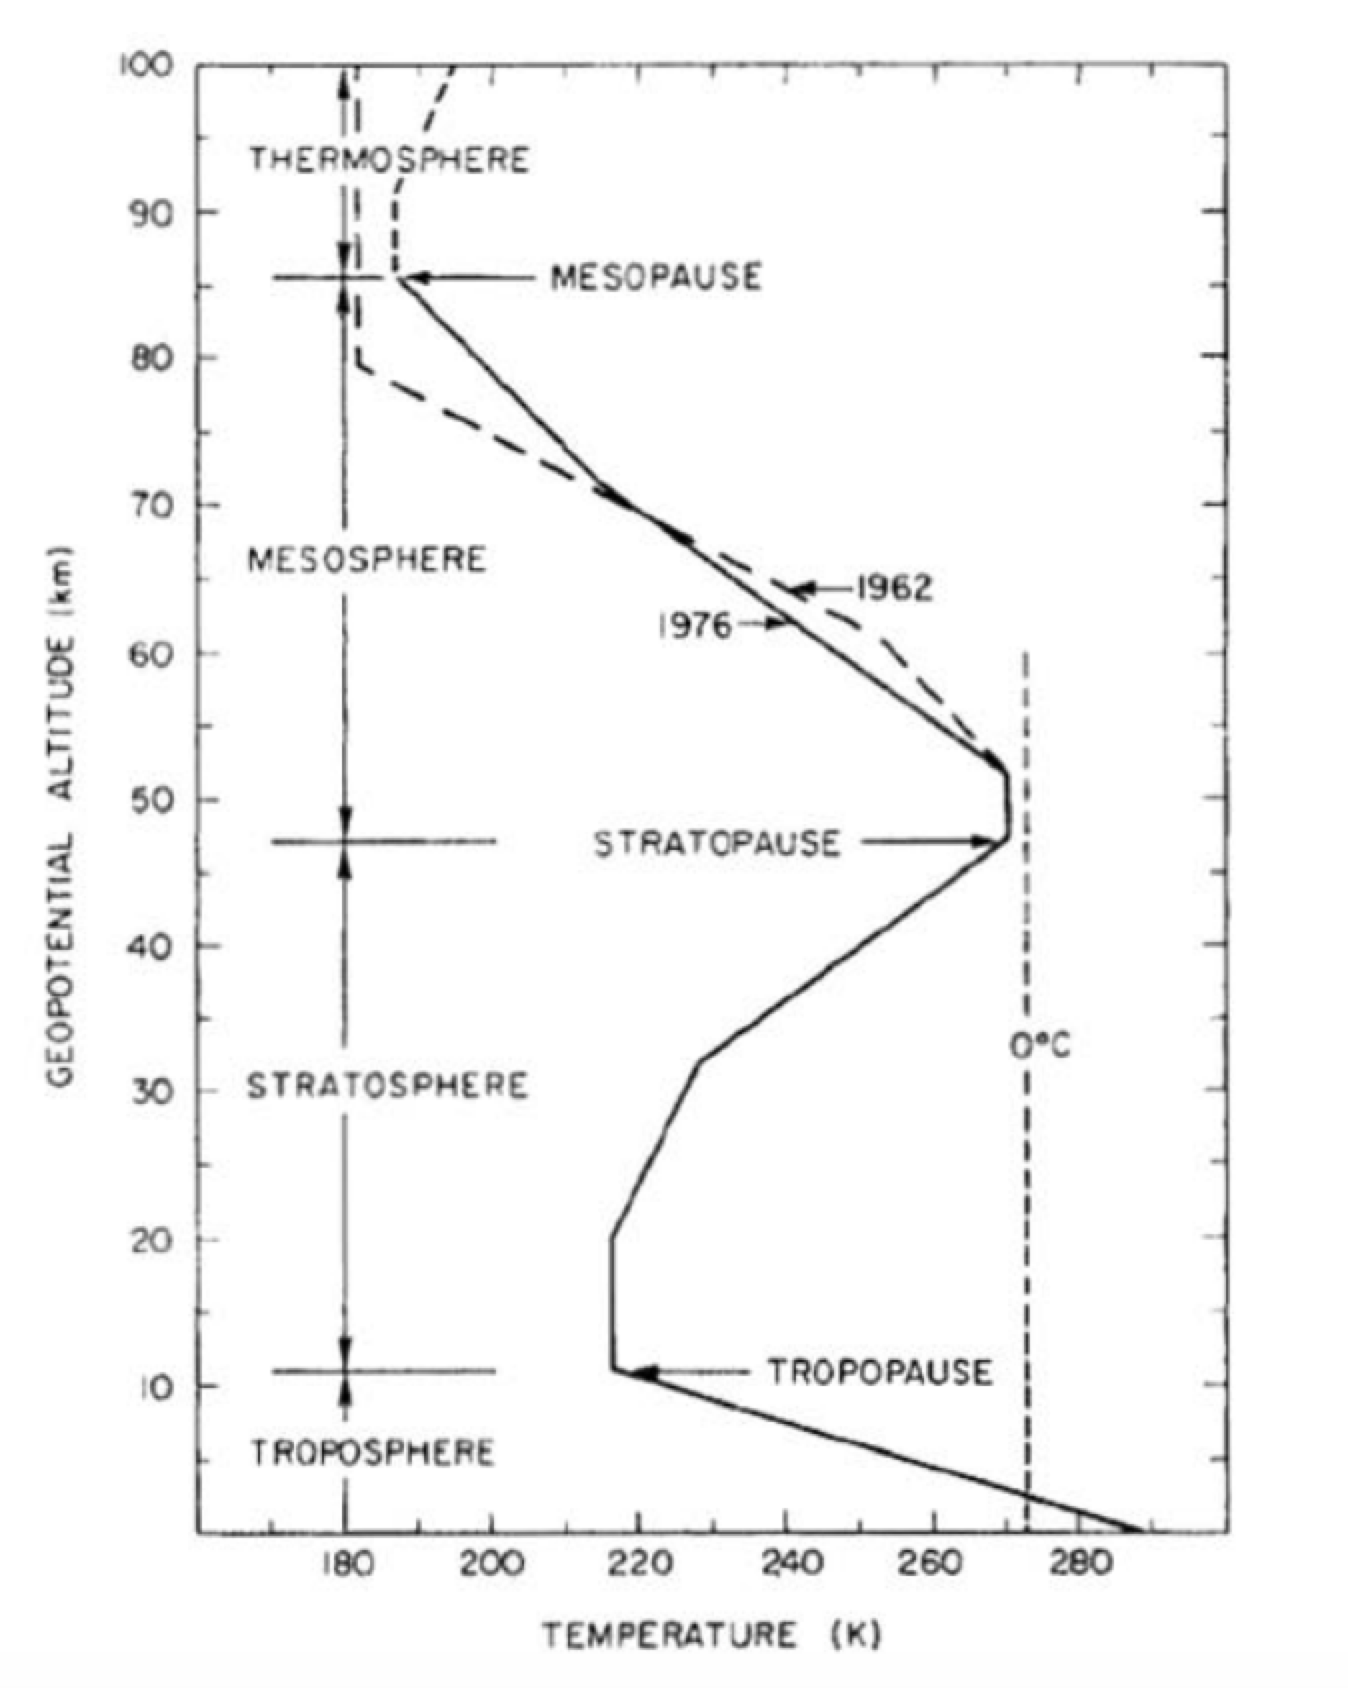
In the troposphere, the temperature decreases with altitude; the earth is the main heat source in which there is absorption of infrared (IR) radiation by trace gases and clouds, and there is convection and conduction of thermal energy. In the stratosphere, the temperature increases with altitude due to the absorption of ultraviolet (UV) radiation from the sun by ozone. In the mesosphere, the temperature decreases with altitude. The atmosphere and earth below the mesosphere are the main source of IR that is absorbed by ozone. In the thermosphere, the sun heats the thermosphere by the absorption of X-rays and UV by oxygen. The temperatures ranges from 500 K to 2000 K depending on the solar activity.
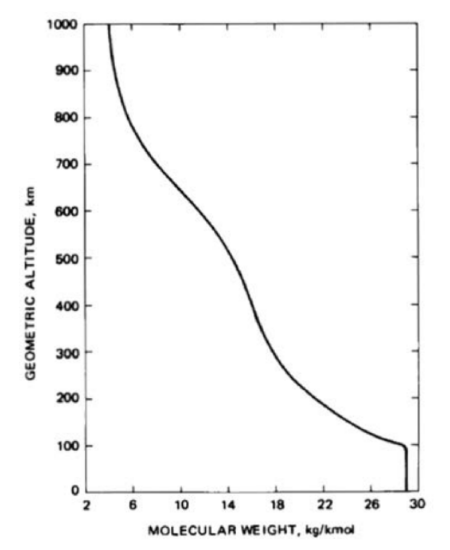
The lower atmosphere is dominated by turbulent mixing which is independent of the molecular mass. Near 100 km, both diffusion and turbulent mixing occur. The upper atmosphere composition is due to diffusion. The ratio of mixing of gases changes and the mean molar mass decreases as a function of height. Only the lightest gases are present at higher levels. The variable components like water vapor and ozone will also affect the absorption of solar radiation and IR radiation from the earth. The graph of height vs. mean molecular weight is shown in Figure 29.7. The number density of individual species and the total number density are plotted in Figure 29.8.
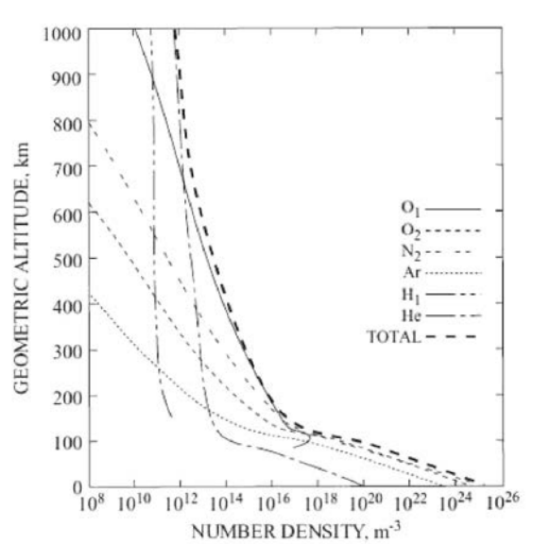
(Note that in the above axis label and caption for Figure 29.8, the term “molecular weight” is used instead of the more appropriate “molecular mass” or “molar mass.”)