Physics LibreTexts

6.4: Applications of Wave Optics

  • Page ID
    17121
  • \( \newcommand{\vecs}[1]{\overset { \scriptstyle \rightharpoonup} {\mathbf{#1}} } \)

    \( \newcommand{\vecd}[1]{\overset{-\!-\!\rightharpoonup}{\vphantom{a}\smash {#1}}} \)

    \( \newcommand{\id}{\mathrm{id}}\) \( \newcommand{\Span}{\mathrm{span}}\)

    ( \newcommand{\kernel}{\mathrm{null}\,}\) \( \newcommand{\range}{\mathrm{range}\,}\)

    \( \newcommand{\RealPart}{\mathrm{Re}}\) \( \newcommand{\ImaginaryPart}{\mathrm{Im}}\)

    \( \newcommand{\Argument}{\mathrm{Arg}}\) \( \newcommand{\norm}[1]{\| #1 \|}\)

    \( \newcommand{\inner}[2]{\langle #1, #2 \rangle}\)

    \( \newcommand{\Span}{\mathrm{span}}\)

    \( \newcommand{\id}{\mathrm{id}}\)

    \( \newcommand{\Span}{\mathrm{span}}\)

    \( \newcommand{\kernel}{\mathrm{null}\,}\)

    \( \newcommand{\range}{\mathrm{range}\,}\)

    \( \newcommand{\RealPart}{\mathrm{Re}}\)

    \( \newcommand{\ImaginaryPart}{\mathrm{Im}}\)

    \( \newcommand{\Argument}{\mathrm{Arg}}\)

    \( \newcommand{\norm}[1]{\| #1 \|}\)

    \( \newcommand{\inner}[2]{\langle #1, #2 \rangle}\)

    \( \newcommand{\Span}{\mathrm{span}}\) \( \newcommand{\AA}{\unicode[.8,0]{x212B}}\)

    \( \newcommand{\vectorA}[1]{\vec{#1}}      % arrow\)

    \( \newcommand{\vectorAt}[1]{\vec{\text{#1}}}      % arrow\)

    \( \newcommand{\vectorB}[1]{\overset { \scriptstyle \rightharpoonup} {\mathbf{#1}} } \)

    \( \newcommand{\vectorC}[1]{\textbf{#1}} \)

    \( \newcommand{\vectorD}[1]{\overrightarrow{#1}} \)

    \( \newcommand{\vectorDt}[1]{\overrightarrow{\text{#1}}} \)

    \( \newcommand{\vectE}[1]{\overset{-\!-\!\rightharpoonup}{\vphantom{a}\smash{\mathbf {#1}}}} \)

    \( \newcommand{\vecs}[1]{\overset { \scriptstyle \rightharpoonup} {\mathbf{#1}} } \)

    \( \newcommand{\vecd}[1]{\overset{-\!-\!\rightharpoonup}{\vphantom{a}\smash {#1}}} \)

    \(\newcommand{\avec}{\mathbf a}\) \(\newcommand{\bvec}{\mathbf b}\) \(\newcommand{\cvec}{\mathbf c}\) \(\newcommand{\dvec}{\mathbf d}\) \(\newcommand{\dtil}{\widetilde{\mathbf d}}\) \(\newcommand{\evec}{\mathbf e}\) \(\newcommand{\fvec}{\mathbf f}\) \(\newcommand{\nvec}{\mathbf n}\) \(\newcommand{\pvec}{\mathbf p}\) \(\newcommand{\qvec}{\mathbf q}\) \(\newcommand{\svec}{\mathbf s}\) \(\newcommand{\tvec}{\mathbf t}\) \(\newcommand{\uvec}{\mathbf u}\) \(\newcommand{\vvec}{\mathbf v}\) \(\newcommand{\wvec}{\mathbf w}\) \(\newcommand{\xvec}{\mathbf x}\) \(\newcommand{\yvec}{\mathbf y}\) \(\newcommand{\zvec}{\mathbf z}\) \(\newcommand{\rvec}{\mathbf r}\) \(\newcommand{\mvec}{\mathbf m}\) \(\newcommand{\zerovec}{\mathbf 0}\) \(\newcommand{\onevec}{\mathbf 1}\) \(\newcommand{\real}{\mathbb R}\) \(\newcommand{\twovec}[2]{\left[\begin{array}{r}#1 \\ #2 \end{array}\right]}\) \(\newcommand{\ctwovec}[2]{\left[\begin{array}{c}#1 \\ #2 \end{array}\right]}\) \(\newcommand{\threevec}[3]{\left[\begin{array}{r}#1 \\ #2 \\ #3 \end{array}\right]}\) \(\newcommand{\cthreevec}[3]{\left[\begin{array}{c}#1 \\ #2 \\ #3 \end{array}\right]}\) \(\newcommand{\fourvec}[4]{\left[\begin{array}{r}#1 \\ #2 \\ #3 \\ #4 \end{array}\right]}\) \(\newcommand{\cfourvec}[4]{\left[\begin{array}{c}#1 \\ #2 \\ #3 \\ #4 \end{array}\right]}\) \(\newcommand{\fivevec}[5]{\left[\begin{array}{r}#1 \\ #2 \\ #3 \\ #4 \\ #5 \\ \end{array}\right]}\) \(\newcommand{\cfivevec}[5]{\left[\begin{array}{c}#1 \\ #2 \\ #3 \\ #4 \\ #5 \\ \end{array}\right]}\) \(\newcommand{\mattwo}[4]{\left[\begin{array}{rr}#1 \amp #2 \\ #3 \amp #4 \\ \end{array}\right]}\) \(\newcommand{\laspan}[1]{\text{Span}\{#1\}}\) \(\newcommand{\bcal}{\cal B}\) \(\newcommand{\ccal}{\cal C}\) \(\newcommand{\scal}{\cal S}\) \(\newcommand{\wcal}{\cal W}\) \(\newcommand{\ecal}{\cal E}\) \(\newcommand{\coords}[2]{\left\{#1\right\}_{#2}}\) \(\newcommand{\gray}[1]{\color{gray}{#1}}\) \(\newcommand{\lgray}[1]{\color{lightgray}{#1}}\) \(\newcommand{\rank}{\operatorname{rank}}\) \(\newcommand{\row}{\text{Row}}\) \(\newcommand{\col}{\text{Col}}\) \(\renewcommand{\row}{\text{Row}}\) \(\newcommand{\nul}{\text{Nul}}\) \(\newcommand{\var}{\text{Var}}\) \(\newcommand{\corr}{\text{corr}}\) \(\newcommand{\len}[1]{\left|#1\right|}\) \(\newcommand{\bbar}{\overline{\bvec}}\) \(\newcommand{\bhat}{\widehat{\bvec}}\) \(\newcommand{\bperp}{\bvec^\perp}\) \(\newcommand{\xhat}{\widehat{\xvec}}\) \(\newcommand{\vhat}{\widehat{\vvec}}\) \(\newcommand{\uhat}{\widehat{\uvec}}\) \(\newcommand{\what}{\widehat{\wvec}}\) \(\newcommand{\Sighat}{\widehat{\Sigma}}\) \(\newcommand{\lt}{<}\) \(\newcommand{\gt}{>}\) \(\newcommand{\amp}{&}\) \(\definecolor{fillinmathshade}{gray}{0.9}\)

    learning objectives

    • Compare optical and electron microscopy

    Microscopes are used to view objects that cannot be seen with the naked eye. In this section we will discuss both optical and electron microscopy.

    Optical Microscopy

    You have probably used an optical microscope in a high school science class. In optical microscopy, light reflected from an object passes through the microscope’s lenses; this magnifies the light. The resultant, magnified image is then seen by the eye. Although this type of microscopy has many limitations, there are several techniques that use properties of light and optics to enhance the magnified image:

    • Bright field: This technique increases the contrast by illuminating the surface on which the objects sit from below.
    • Oblique illumination: This technique illuminates the object from the side, giving it a three-dimensional appearance and highlighting features that would otherwise not be visible.
    • Dark field: This technique is good for improving the contrast of transparent objects. A carefully aligned light source minimizes the un-scattered light entering the object plane and so only collects the light that is scattered by the object itself.
    • Dispersion staining: This results in a colored image of a colorless object; it does not actually require that the object be stained.
    • Phase contrast: This uses the refractive index of an object to show differences in optical density as a difference in contrast. provides a demonstration of this technique.

    Electron Microscopy

    Electron microscopes use electron beams to achieve higher resolutions than are possible in optical microscopy. Two kinds of electron microscopes are:

    • Transmission electron microscope (TEM): The TEM sends an electron beam through a thin slice of a specimen. The electron interacts with the specimen and is then transmitted onto photographic paper or a screen. Since electron beams have a much smaller wavelength than traditional light, the resolution of the resulting image is much higher.
    • Scanning electron microscope (SEM): The SEM shows details on the surface of a specimen and produces a three-dimensional view by scanning the specimen. shows an SEM image of pollen.

    The Spectrometer

    A spectrometer uses properties of light to identify atoms by measuring wavelength and frequency, which are functions of radiated energy.

    learning objectives

    • Compare design and function of early and modern spectrometers

    The Spectrometer

    A spectrometer is an instrument used to intensely measure light over a specific portion of the electromagnetic spectrum, to identify materials. The instrument produces lines, much like those produced from diffraction grating as covered in a previous atom, and then measures the wavelengths and intensities of those lines.

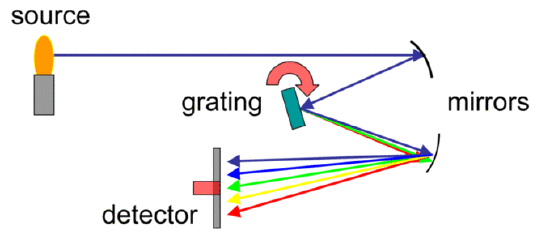
    shows a diagram of how a spectrometer works. The source is placed in front of a mirror, which reflects the light emitted from that object onto a diffraction grating. This grating then disperses the emitted light to anther mirror which spreads the different resultant wavelengths and reflects them onto a detector which records the findings. This type of instrument is used in spectroscopy.

    image

    Spectrometer Diagram: This diagram shows the light pathways in a spectrometer.

    Spectroscopy

    Spectroscopy studies the interaction between matter and radiated energy. This radiated energy is a function of wavelength and frequency. Every type of atom has its own frequency. When the spectrometer produces a reading, the observer can then use spectroscopy to identify the atoms and therefore molecules that make up that object.

    Spectroscopes

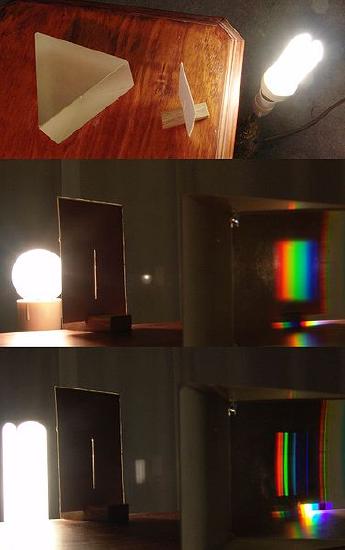
    Spectroscopes are used in a variety of fields, such as astronomy and chemistry. They use a diffraction grating, movable slit, and a photodetector. All of these elements are controlled by a computer, which records the findings. A material is heated to incandescence and it emits a light that is characteristic of its atomic makeup. Each atom has its own spectroscopic ‘fingerprint’. In you can see a very simple spectroscope based on a prism. As another example, Sodium produces a double yellow band.

    image

    A simple spectroscope: A very simple spectroscope based on a prism

    The Michelson Interferometer

    The Michelson interferometer is the most common configuration for optical interferometry.

    learning objectives

    • Explain how the Michelson interferometer works

    Interferometry

    Before we can discuss the Michelson Interferometer, it is important we first understand interferometry—which refers to techniques that use superimposed waves to extract information about the waves. More simply, it uses the interference these waves experience to make accurate measurements of the waves. It is used in many areas of science, such as astronomy, engineering, oceanography, physics, and fiber optics.

    Popular applications of interferometry in industry include the measurement of small displacements, refractive index changes, and surface irregularities. As shown in previous atoms, when two waves with the same frequency combine, the resulting pattern is determined by the phase difference between the two. Constructive interference occurs when the waves are in phase, and destructive interference occurs when they are out of phase. Interferometry uses this principle to combine waves and study the resulting wave in order to obtain information about the original state of the waves.

    The Michelson Interferometer

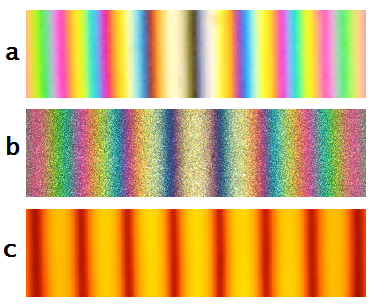
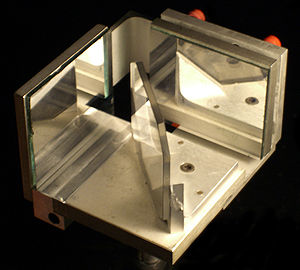
    The most common tool in interferometry, the Michelson Interferometer, shown in Figure 1, was invented by Albert Abraham Michelson, the first American to win a Nobel Prize for science. The interferometer works by splitting a beam of light into two paths, bouncing them back and then recombining them to create an interference pattern. To create interference fringes on a detector (see Figure 2 ), the paths may be different lengths or composed of different materials.

    image

    Fringes in a Michelson Interferometer: Colored and monochromatic fringes in a Michelson interferometer: (a) White light fringes where the two beams differ in the number of phase inversions; (b) White light fringes where the two beams have experienced the same number of phase inversions; and (c) Fringe pattern using monochromatic light (sodium D lines).

    image

    Michelson Interferometer: A Michelson Interferometer.

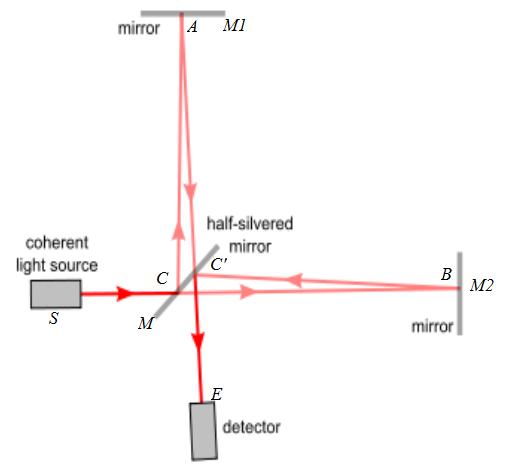
    Figure 3 shows a diagram of how a Michelson Interferometer works. M1 and M2 are two highly polished mirrors, S is the light source, M is a half silvered mirror that acts as a beam splitter when the light hits the surface, and C is a point on M that is partially reflective. When the beam S hits this point on M it is split into two beams. One beam is reflected in the direction of A and the other is transmitted through the surface of M to the point B. A and B are both points on the highly polished (and therefore reflective) mirrors M1 and M2. When the beams hit these points, they are then reflected back to point C’, where they recombine to produce an interference pattern. At point E, the interference pattern produced at point C’ is visible to an observer.

    image

    Figure 3: This diagram of a Michelson Interferometer shows the path that the light waves travels in the instrument.

    Applications

    The Michelson Interferometer has been used for the detection of gravitational waves, as a tunable narrow band filter, and as the core of Fourier transform spectroscopy. It has played an important role in studies of the upper atmosphere, revealing temperatures and winds (employing both space-borne and ground-based instruments) by measuring the Doppler widths and shifts in the spectra of airglow and aurora. The best known application of the Michelson Interferometer is the Michelson-Morley experiment—a failed attempt to demonstrate the effect of the hypothetical ” aether wind” on the speed of light. Their experiment left theories of light based on the existence of a luminiferous aether without experimental support, and served ultimately as an inspiration for special relativity.

    LCDs

    Liquid crystal displays use liquid crystals which do not emit light, but use the light modulating properties of the crystals.

    learning objectives

    • Explain how liquid crystal displays produce images and discuss their benefits and deficiencies

    LCDs

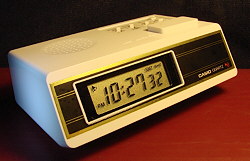
    LCD stands for a liquid crystal display. The liquid crystals themselves do not emit light, but the display uses the light modulating properties of the crystals. LCDs can be used to display arbitrary images, such as in a computer monitor or television, by using a large number of very small pixels, or they can be used to display fixed images, like a digital clock, such as in.

    image

    Digital Clock: A digital clock which uses LCD to either hide or display fixed images.

    Unlike the newer cathode ray tube (CRT) and plasma displays, LCDS do not use phosphors. For this reason they do not suffer image burn-in. They do however suffer image persistence. Image burn-in occurs when an image is displayed so many times, or for so long, that an outline of image can be seen even when the display is turned off. Image persistence is similar, but the outline fades away shortly after the display is turned off and is not permanent.

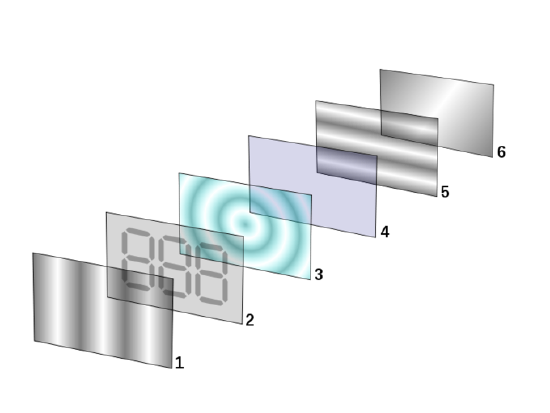
    LCD displays are made up of numerous layers. A typical layer is diagrammed in. Each pixel of an LCD consists of a layer of molecules aligned between two transparent electrodes and two polarizing films, and the actual liquid crystals are between these polarizing filters. The light passes through the first filter, and is blocked by the second. The electrodes are used to align the crystals in a particular direction, which produces the image seen on the screen. The crystals do not emit any light, but rather give the light a specific shape to be emitted in.

    image

    Layers of LCD Displays: Polarizing filter film with a vertical axis to polarize light as it enters.Glass substrate with ITO electrodes. The shapes of these electrodes will determine the shapes that will appear when the LCD is turned on. Vertical ridges etched on the surface are smooth.Twisted nematic liquid crystal.Glass substrate with common electrode film (ITO) with horizontal ridges to line up with the horizontal filter.Polarizing filter film with a horizontal axis to block/pass light.Reflective surface to send light back to viewer. (In a backlit LCD, this layer is replaced with a light source. )

    Twisted Nematic Devices

    The twisted nematic device is the most common LCD application. When no electric field is being applied, the surface alignment directions at the electrodes are perpendicular to each other. The molecules arrange themselves in a helical structure (twisted structure). Some light is able to pass through and some is not, so the result is that the screen appears gray. When the electric field is applied, the crystals in the center layer untwist, and the light is completely blocked from passing through and those pixels will appear black.

    Using Interference to Read CDs and DVDs

    Optical discs are digital storing media read in an optical disc drive using laser beam.

    learning objectives

    • Explain how information is stored on the optical disks

    Overview

    Compact disks (CDs) and digital video disks (DVDs) are examples of optical discs. They are read in an optical disc drive which directs a laser beam at the disc. The reader then detects whether the beam has been reflected or scattered.

    Function of Digital Discs

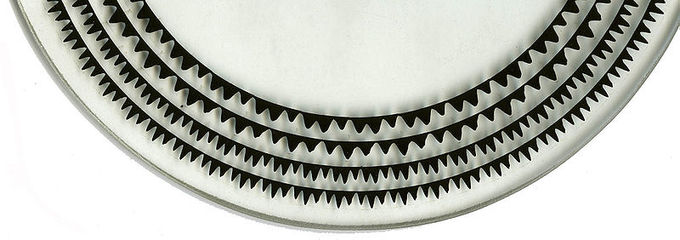
    Optical discs are digital storing media. They can store music, files, movies, pictures etc.. These discs are flat, usually made of aluminum, and have microscopic pits and lands on one of the flat surfaces (as shown in ). The information on these discs are read by a computer in the form of binary data. First, a laser beam is shot at the disc. If the beam hits a land, it gets reflected back and is recorded as a value of 1. If the beam hits a pit, it gets scattered and is recorded as a value of zero.

    image

    Early Version of an Optical Disc: In this early version of an optical disc, you can see the pits and lands which either reflect back light or scatter it.

    These microscopic pits and lands cover the entire surface of the disc in a spiral path, starting in the center and working its way outward. The data is stored either by a stamping machine or laser and is read when the data is illuminated by a laser diode in the disc drive. The disc spins at a faster speed when it is being read in the center track, and slower for an outer track. This is because the center tracks are smaller in circumference and therefore can be read quicker.

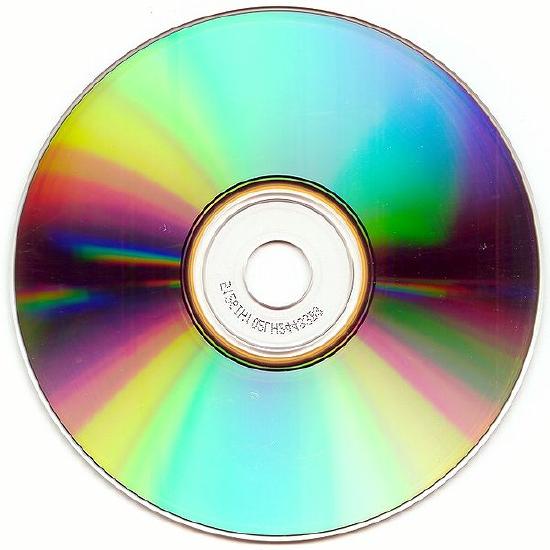
    These pits also act as slits and cause the light to be diffracted as it is reflected back, which causes an iridescent effect. This explains the rainbow pattern that you see on the back of a CD, as shown in.

    image

    Compact Disc: The bottom surface of a compact disc showing characteristic iridescence.

    Key Points

    • In optical microscopy, light reflected from an object passes through the microscope’s lenses; this magnifies the light. The resultant, magnified image is then seen by the eye. This technique has many limitations but can be enhanced in various ways to create more contrast.
    • The transmission electron microscope (TEM) sends an electron beam through a thin slice of a specimen. The electron is then transmitted onto photographic paper or a screen. Since electron beams have a much smaller wavelength than traditional light, the resolution of this image is much higher.
    • The scanning electron microscope (SEM) shows details on the surface of a specimen and produces a three-dimensional view by scanning the specimen.
    • The source is placed in front of a mirror, which reflects the light emitted from that object onto a diffraction grating. This grating then disperses the emitted light to anther mirror which spreads the different resultant wavelengths and reflects them onto a detector which records the findings.
    • Early forms of spectrometers were simple prisms, but modern spectrometers are automated by a computer and can record a much broader range of frequencies.
    • Spectrometers are used in spectroscopy. Spectroscopy studies the interaction between matter and radiated energy. This radiated energy is a function of wavelength and frequency. Every type of atom has its own frequency.
    • Interferometry refers to techniques that use superimposed waves to extract information about the waves.
    • Michelson interferometer works by splitting a beam of light into two paths, bouncing them back and recombining them to create an interference pattern. To create interference fringes on a detector, the paths may be different lengths or composed of different materials.
    • The best known application of the Michelson interferometer is the Michelson-Morley experiment, the unexpected null result of which was an inspiration for special relativity.
    • LCDs use an electric field to arrange the liquid crystals into the desired pattern, and then pass light through these layers to produce an image on the screen.
    • LCDs can be used to display an arbitrary image made up of tiny fixed pixels, or can be used to display a fixed image, as in on a digital clock.
    • A twisted nematic display is the most common LCD in use. This type of display is on calculators, digital watches, and clocks. When no electric field is applied, the molecules are twisted, and let some light through. When the field is applied, they untwist, blocking the light and are seen as black.
    • The iridescent layer of the disc is imprinted with tiny pits and lands. Pits scatter light when illuminated, and produce a reading of 0; lands reflect light back and produce a reading of 1.
    • The optical disc drive records the 0 and 1 readings and translates them into binary data which is used to relay whatever information is recorded on the disc.
    • Rainbow pattern on the back of a CD is due diffraction of the reflected light by pits.

    Key Terms

    • microscopy: using microscopes to view objects that cannot be seen with the naked eye
    • contrast: A difference in lightness, brightness and/or hue between two colors that makes them more or less distinguishable
    • incandescence: Incandescence is the emission of light (visible electromagnetic radiation) from a hot body as a result of its temperature.
    • special relativity: A theory that (neglecting the effects of gravity) reconciles the principle of relativity with the observation that the speed of light is constant in all frames of reference.
    • superimposed: Positioned on or above something else, especially in layers
    • interference: An effect caused by the superposition of two systems of waves, such as a distortion on a broadcast signal due to atmospheric or other effects.
    • LCD: a liquid crystal display.
    • helical: In the shape of a helix, twist.
    • nematic: Describing the structure of some liquid crystals whose molecules align in loose parallel lines.
    • binary data: Data which can take on only two possible values, traditionally termed 0 and 1.
    • pit: An imprint on an optical disc that scatters light when illuminated.
    • land: A flat area on an optical disc that reflects light when illuminated.

    LICENSES AND ATTRIBUTIONS

    CC LICENSED CONTENT, SHARED PREVIOUSLY

    CC LICENSED CONTENT, SPECIFIC ATTRIBUTION


    6.4: Applications of Wave Optics is shared under a not declared license and was authored, remixed, and/or curated by LibreTexts.