
2.2: Activities
- Page ID
- 51731

\( \newcommand{\vecs}[1]{\overset { \scriptstyle \rightharpoonup} {\mathbf{#1}} } \)
\( \newcommand{\vecd}[1]{\overset{-\!-\!\rightharpoonup}{\vphantom{a}\smash {#1}}} \)
\( \newcommand{\dsum}{\displaystyle\sum\limits} \)
\( \newcommand{\dint}{\displaystyle\int\limits} \)
\( \newcommand{\dlim}{\displaystyle\lim\limits} \)
\( \newcommand{\id}{\mathrm{id}}\) \( \newcommand{\Span}{\mathrm{span}}\)
( \newcommand{\kernel}{\mathrm{null}\,}\) \( \newcommand{\range}{\mathrm{range}\,}\)
\( \newcommand{\RealPart}{\mathrm{Re}}\) \( \newcommand{\ImaginaryPart}{\mathrm{Im}}\)
\( \newcommand{\Argument}{\mathrm{Arg}}\) \( \newcommand{\norm}[1]{\| #1 \|}\)
\( \newcommand{\inner}[2]{\langle #1, #2 \rangle}\)
\( \newcommand{\Span}{\mathrm{span}}\)
\( \newcommand{\id}{\mathrm{id}}\)
\( \newcommand{\Span}{\mathrm{span}}\)
\( \newcommand{\kernel}{\mathrm{null}\,}\)
\( \newcommand{\range}{\mathrm{range}\,}\)
\( \newcommand{\RealPart}{\mathrm{Re}}\)
\( \newcommand{\ImaginaryPart}{\mathrm{Im}}\)
\( \newcommand{\Argument}{\mathrm{Arg}}\)
\( \newcommand{\norm}[1]{\| #1 \|}\)
\( \newcommand{\inner}[2]{\langle #1, #2 \rangle}\)
\( \newcommand{\Span}{\mathrm{span}}\) \( \newcommand{\AA}{\unicode[.8,0]{x212B}}\)
\( \newcommand{\vectorA}[1]{\vec{#1}} % arrow\)
\( \newcommand{\vectorAt}[1]{\vec{\text{#1}}} % arrow\)
\( \newcommand{\vectorB}[1]{\overset { \scriptstyle \rightharpoonup} {\mathbf{#1}} } \)
\( \newcommand{\vectorC}[1]{\textbf{#1}} \)
\( \newcommand{\vectorD}[1]{\overrightarrow{#1}} \)
\( \newcommand{\vectorDt}[1]{\overrightarrow{\text{#1}}} \)
\( \newcommand{\vectE}[1]{\overset{-\!-\!\rightharpoonup}{\vphantom{a}\smash{\mathbf {#1}}}} \)
\( \newcommand{\vecs}[1]{\overset { \scriptstyle \rightharpoonup} {\mathbf{#1}} } \)
\(\newcommand{\longvect}{\overrightarrow}\)
\( \newcommand{\vecd}[1]{\overset{-\!-\!\rightharpoonup}{\vphantom{a}\smash {#1}}} \)
\(\newcommand{\avec}{\mathbf a}\) \(\newcommand{\bvec}{\mathbf b}\) \(\newcommand{\cvec}{\mathbf c}\) \(\newcommand{\dvec}{\mathbf d}\) \(\newcommand{\dtil}{\widetilde{\mathbf d}}\) \(\newcommand{\evec}{\mathbf e}\) \(\newcommand{\fvec}{\mathbf f}\) \(\newcommand{\nvec}{\mathbf n}\) \(\newcommand{\pvec}{\mathbf p}\) \(\newcommand{\qvec}{\mathbf q}\) \(\newcommand{\svec}{\mathbf s}\) \(\newcommand{\tvec}{\mathbf t}\) \(\newcommand{\uvec}{\mathbf u}\) \(\newcommand{\vvec}{\mathbf v}\) \(\newcommand{\wvec}{\mathbf w}\) \(\newcommand{\xvec}{\mathbf x}\) \(\newcommand{\yvec}{\mathbf y}\) \(\newcommand{\zvec}{\mathbf z}\) \(\newcommand{\rvec}{\mathbf r}\) \(\newcommand{\mvec}{\mathbf m}\) \(\newcommand{\zerovec}{\mathbf 0}\) \(\newcommand{\onevec}{\mathbf 1}\) \(\newcommand{\real}{\mathbb R}\) \(\newcommand{\twovec}[2]{\left[\begin{array}{r}#1 \\ #2 \end{array}\right]}\) \(\newcommand{\ctwovec}[2]{\left[\begin{array}{c}#1 \\ #2 \end{array}\right]}\) \(\newcommand{\threevec}[3]{\left[\begin{array}{r}#1 \\ #2 \\ #3 \end{array}\right]}\) \(\newcommand{\cthreevec}[3]{\left[\begin{array}{c}#1 \\ #2 \\ #3 \end{array}\right]}\) \(\newcommand{\fourvec}[4]{\left[\begin{array}{r}#1 \\ #2 \\ #3 \\ #4 \end{array}\right]}\) \(\newcommand{\cfourvec}[4]{\left[\begin{array}{c}#1 \\ #2 \\ #3 \\ #4 \end{array}\right]}\) \(\newcommand{\fivevec}[5]{\left[\begin{array}{r}#1 \\ #2 \\ #3 \\ #4 \\ #5 \\ \end{array}\right]}\) \(\newcommand{\cfivevec}[5]{\left[\begin{array}{c}#1 \\ #2 \\ #3 \\ #4 \\ #5 \\ \end{array}\right]}\) \(\newcommand{\mattwo}[4]{\left[\begin{array}{rr}#1 \amp #2 \\ #3 \amp #4 \\ \end{array}\right]}\) \(\newcommand{\laspan}[1]{\text{Span}\{#1\}}\) \(\newcommand{\bcal}{\cal B}\) \(\newcommand{\ccal}{\cal C}\) \(\newcommand{\scal}{\cal S}\) \(\newcommand{\wcal}{\cal W}\) \(\newcommand{\ecal}{\cal E}\) \(\newcommand{\coords}[2]{\left\{#1\right\}_{#2}}\) \(\newcommand{\gray}[1]{\color{gray}{#1}}\) \(\newcommand{\lgray}[1]{\color{lightgray}{#1}}\) \(\newcommand{\rank}{\operatorname{rank}}\) \(\newcommand{\row}{\text{Row}}\) \(\newcommand{\col}{\text{Col}}\) \(\renewcommand{\row}{\text{Row}}\) \(\newcommand{\nul}{\text{Nul}}\) \(\newcommand{\var}{\text{Var}}\) \(\newcommand{\corr}{\text{corr}}\) \(\newcommand{\len}[1]{\left|#1\right|}\) \(\newcommand{\bbar}{\overline{\bvec}}\) \(\newcommand{\bhat}{\widehat{\bvec}}\) \(\newcommand{\bperp}{\bvec^\perp}\) \(\newcommand{\xhat}{\widehat{\xvec}}\) \(\newcommand{\vhat}{\widehat{\vvec}}\) \(\newcommand{\uhat}{\widehat{\uvec}}\) \(\newcommand{\what}{\widehat{\wvec}}\) \(\newcommand{\Sighat}{\widehat{\Sigma}}\) \(\newcommand{\lt}{<}\) \(\newcommand{\gt}{>}\) \(\newcommand{\amp}{&}\) \(\definecolor{fillinmathshade}{gray}{0.9}\)Equipment
- string & pulley assembly
- weights
- wave generator driven with Pasco software
- tape measure
- spare length of string for direct density measurement
- triple beam balance
The General Idea
In this lab, we will use standing waves to measure the density of the string in which those waves vibrate. We will do this by noting that every string tension has its own fundamental harmonic (as any guitar player knows). The relationship between the tension and the fundamental harmonic involves the mass density of the string and the distance between its two fixed ends, and this comes from the role that tension and mass density play in the traveling wave velocity.
We have the tools to drive a standing wave at whatever frequency we like, and at the same time we can hang whatever weight we like from the string. If we tune the frequency to the hanging weight, we can create a standing wave in the string. The standing wave doesn't have to actually be vibrating at the fundamental frequency to determine what it is, because we can easily count the number of antinodes, and \(f_1 = \frac{f_n}{n}\). By changing the weight several times and recording the corresponding fundamental frequencies, we have data that we can use for a best-fit line (linear regression) to find the string density. The formula for this line comes directly from equations we are already familiar with; the wavelength of the fundamental harmonic for a string wave with both ends fixed is \(2L\), where \(L\) is the distance between the endpoints, so:
\[\sqrt{\dfrac{T}{\mu}} = v = \lambda f = \left(2L\right) f_1 \;\;\;\Rightarrow \;\;\; T=\left(4L^2\mu\right)\;f_1^2\]
Some Things to Think About
There are two sections of advice here. The first consists of pointers on the actual process of taking data. There are many nuances of the software and the apparatus that are useful to know so that you don't waste a lot of time. The second is advice in doing the analysis.
Equipment
With the laptop powered off, turn on the Pasco box. Then power-up the laptop. You will find the application in the 9B folder on the desktop of the laptop. It is called "Standing_Waves." Below is a picture of the control panel in the software.
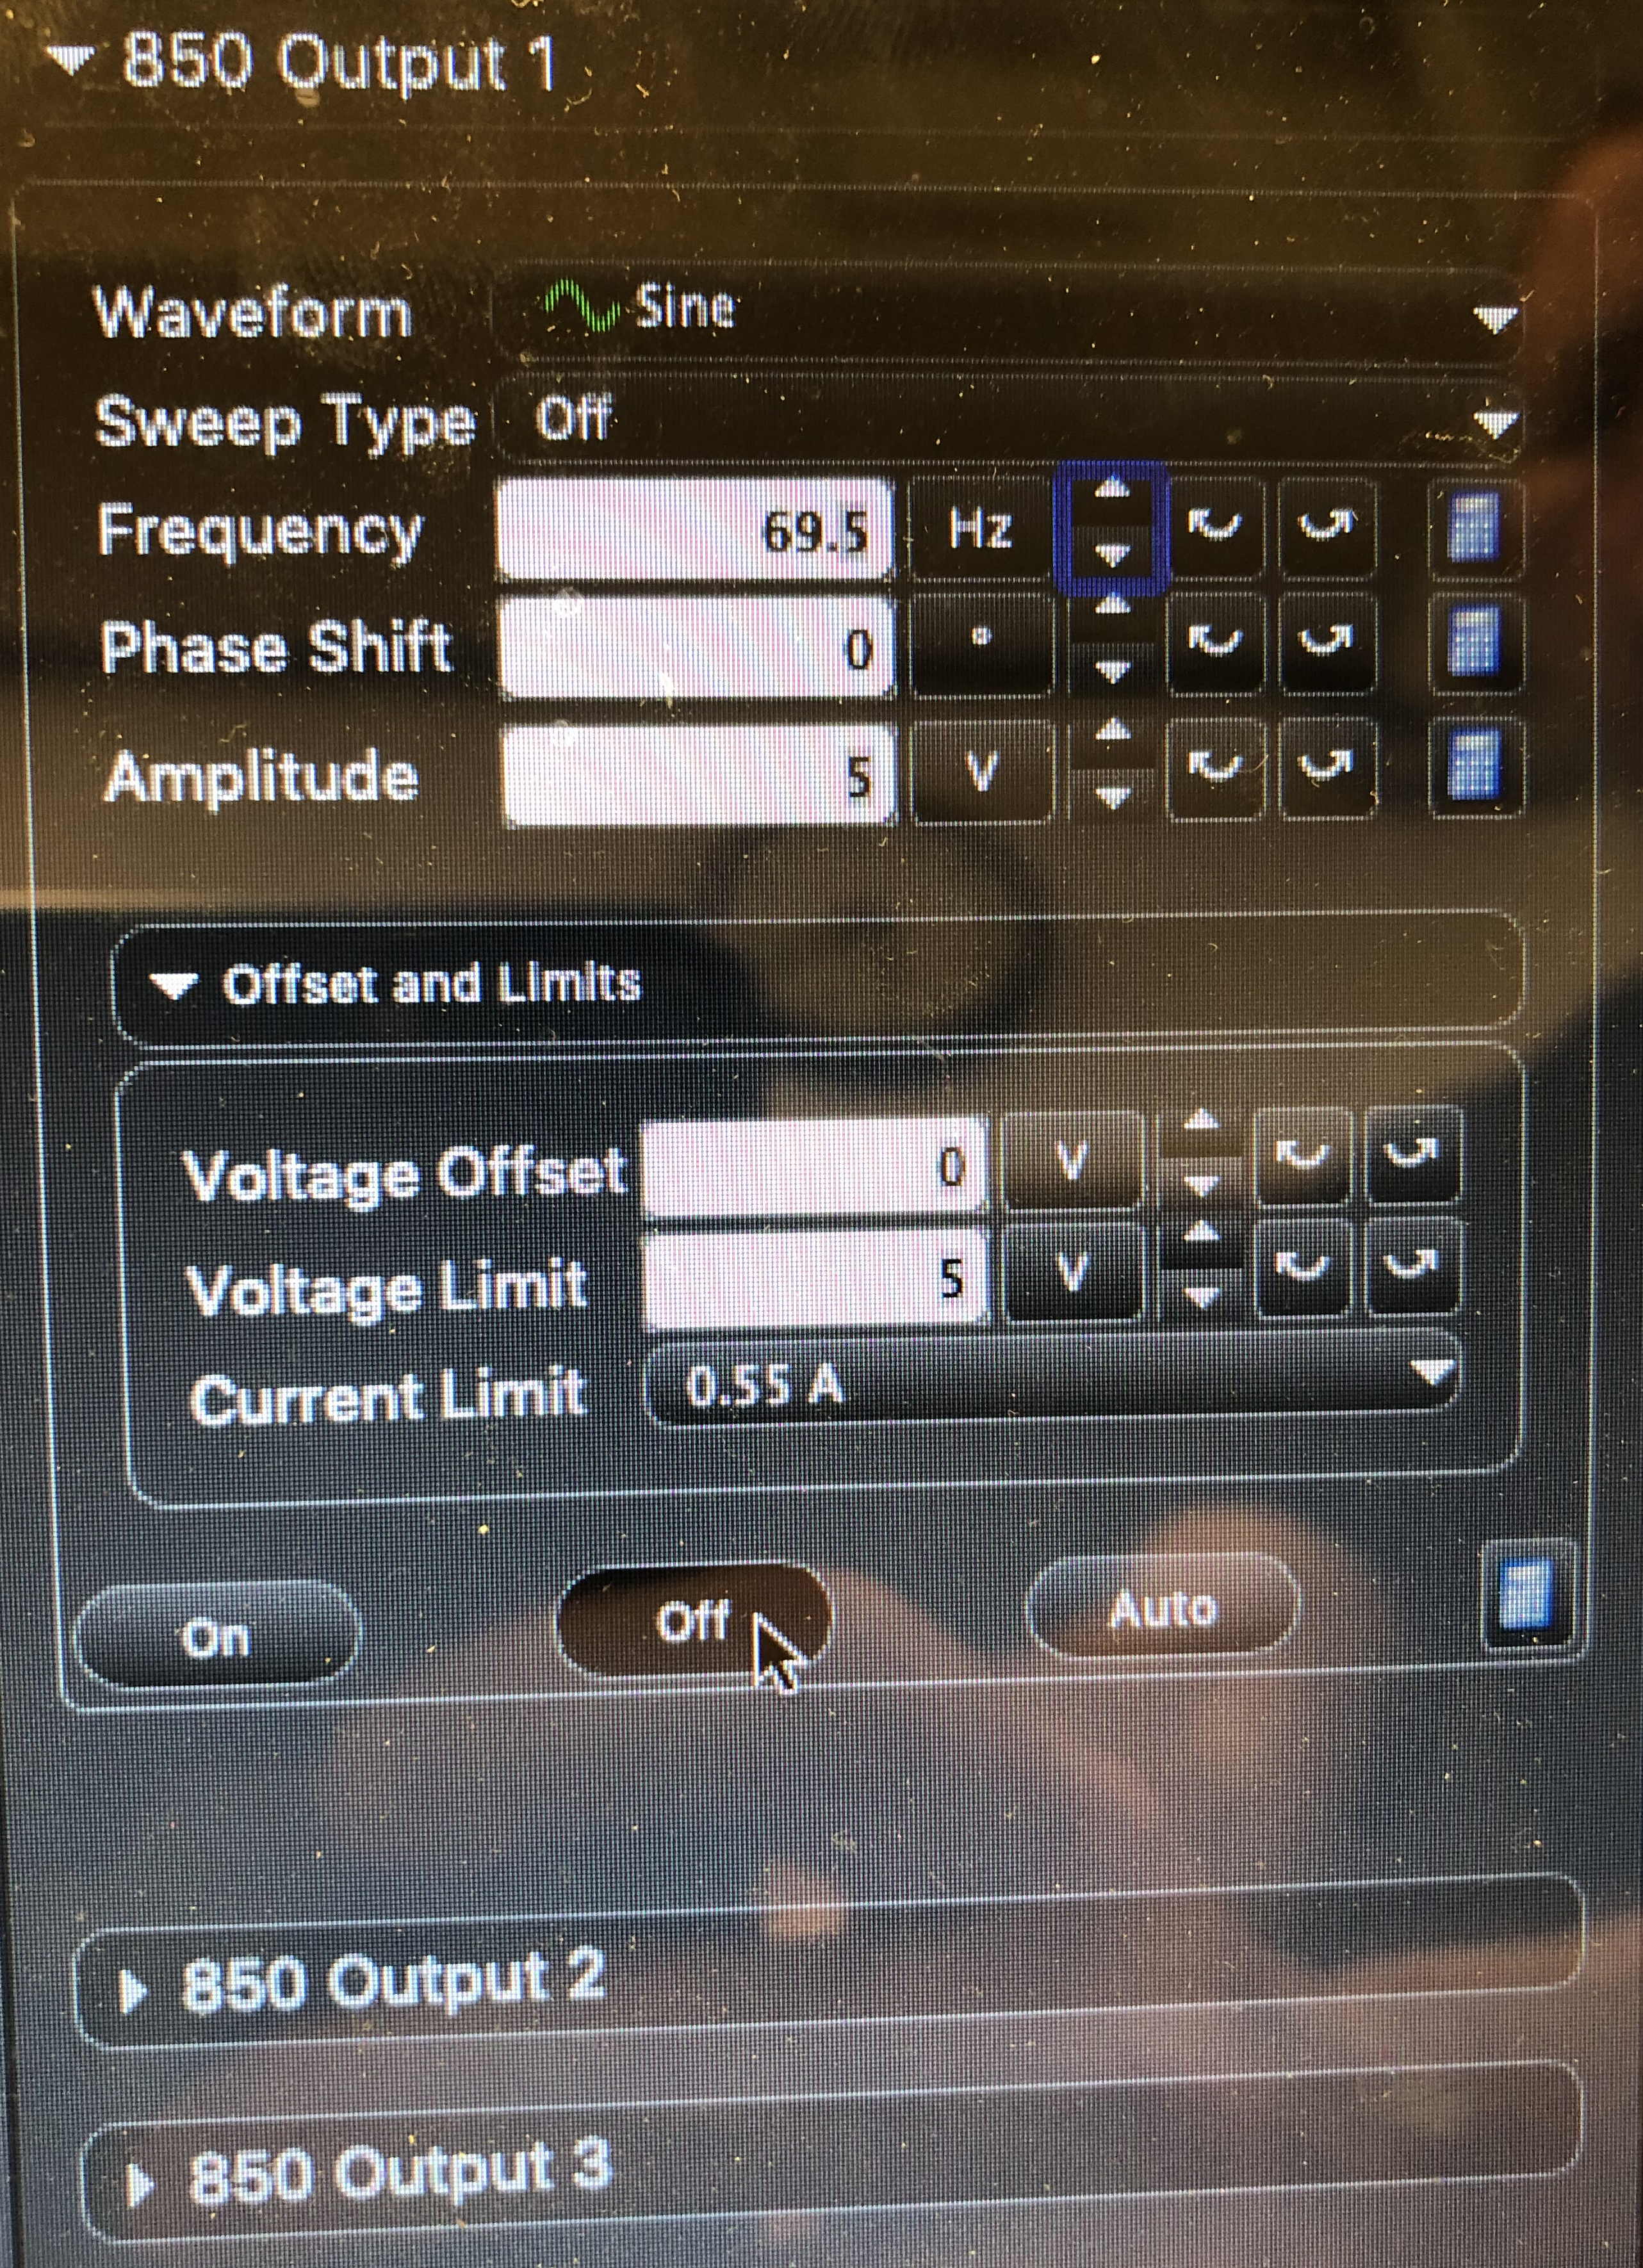
- Only "Output 1" is involved here (it comes from the ports into which the wires are connected).
- "Waveform" should be left in the default setting of "sine".
- "Sweep Type" should be left in the default setting of "off".
- The "Phase Shift" and "Voltage Offset" numbers are unimportant and should be left at the default setting of zero.
- The default "Amplitude" is 1V, but it will likely need to be made higher. It will only go to 2 unless you increase the "Voltage Limit" value. You may make this increase (only if you need to!), but under no circumstances should it go above 5V. If you can't seem to generate a standing wave with the amplitude set at 5, call over your TA for assistance.
- "Current Limit" should not be changed.
- You can turn the oscillator on and off with the buttons conveniently labeled with those very names. Always turn off the oscillator when changing weights.
- The simplest method for searching for harmonics is as follows:
- Estimate a frequency for the new weight.
- Make sure that the digit in the one's place of the "Frequency" field is selected, and use the up/down arrows on the keyboard for increase or decrease the frequency by units of \(1 Hz\) (if the ten's place is highlighted, those arrows will make changes in units of \(10 Hz\)).
- When you hit a frequency that gets the string to start to jiggle, click inside the Frequency field after the one's place, and the first decimal place will appear. Now toggling the up and down arrow keys will change the frequency by tenths of hertz. When you find the standing wave that has steady nodes and has the largest possible antinodes (which remain consistent and don't periodically dissolve and re-form), you have found a harmonic.
- When you have found one harmonic with a given weight and are ready to search for another, do a quick computation to make an educated guess at what one should be, and type-in that frequency to start your search, so that you don't spend a lot of time searching blindly. Even if your guess is very good, you should fine-tune it.
- A node (other than those at the endpoints) is useful for pinpointing an harmonic, and higher frequencies have lower percentage uncertainties, so you should not use the standing wave in its fundamental harmonic useless absolutely necessary. Don't use harmonics higher than 4th.
- The best results seem to be achieved for weights between \(200g\) and \(1000g\), with higher harmonics working well for smaller masses and lower harmonics for higher masses.
- Take data for at least 5 different weights (with two harmonics for each), or your graph's usefulness will be marginal.
Analysis
- As mentioned above, the fundamental frequency does not need to be measured directly, because we know how to extract this value from the measured frequency and number of antinodes. What is more, being able to measure the same quantity more than one way is valuable in experimentation as a way of reducing uncertainty. So for each tension in the string, you should make two separate measurements of the fundamental frequency (which you can then average).
- The relationship between the tension and the fundamental frequency isn't linear, but a graph of tension versus some appropriate function of the fundamental frequency will still result in a line, allowing us to carryout our plan. You can review this Background material from an old 9A lab for a refresher of how this works.
- As usual, for your plots you should use the usual online graphing calculator to plot your data points. Here is a reminder of how to get the best-fit line (do the linear regression) on Desmos: Create the data table by clicking on the "+" in the upper-left corner, and selecting "table". You will see that the variables "\(x_1\)" and "\(y_1\)" are used in the table. In the next box, put in the equation for a line with these two variables, but instead of using an equal sign, use "~". So it should look like "\(y_1\)~\(mx_1+b\)". A best-fit line will be drawn for you, and the values of \(m\) and \(b\) for this line will be displayed.
- From the best fit line, we can extract the slope (actually Desmos does this for us), but this is not exactly the mass density we are looking for, so you will have to calculate it from the slope, with the help of another measurement.
- After computing the mass density, you can check your answer by measuring the length and mass of a string similar to the one in your apparatus. Do not detach the string from your apparatus for this purpose. Every group in the class does not need to make this measurement once one group has done it and another group has confirmed it – everyone can use their findings.
- While we could do so, we will continue to eschew extracting a measure of the uncertainty of our answer from the linear regression results, but we can still nevertheless compute the uncertainty of the direct measurement (use the weakest link rule for this), and the experimental result can be compared using this uncertainty. Be sure to elaborate other possible sources of uncertainty not accounted-for.
Lab Report
Craft a lab report for these activities and analysis, making sure to include every contributing group member's name on the front page. You are strongly encouraged to refer back to the Read Me as you do this, to make sure that you are not leaving out anything important. You should also feel free to get feedback from your lab TA whenever you find that your group is at an impasse.
Every member of the group must upload a separate digital copy of the report to their lab assignment in Canvas prior to leaving the lab classroom. These reports are not to be written outside the lab setting.