
5.9: Raman Spectroscopy on Membranes


- Last updated
- Mar 28, 2021
- Save as PDF
( \newcommand{\kernel}{\mathrm{null}\,}\)
Raman spectroscopy is a spectroscopic technique that was developed by the Indian physicist Sir Chandrasekhara Venkata Raman in the first quarter of the 20thCentury which led to his Nobel prize in physics in 1930.1 His Nobel prize was based on the discovery and ability to quantitatively understand the structure of molecules through the detection of inelastically scattered light when a sample is exposed to radiation of a specific frequency.
Classical Model of Scattering
The classical model for the scattering of light in Raman spectroscopy is a process in which the oscillating electric field (→E) from a specific frequency of light ( ) induces a dipole moment (→μinduced) in a molecule. The magnitude of the dipole moment depends on the molecules polarizability (α).
→μinduced=α→E
The electric field which oscillates at a specific frequency () can be represented as:
→E=Eocos(2πνot)
In this classical model, the oscillating dipole produces energy in which all frequencies of the light are emitted in all directions except the positions parallel to the induced dipole. This scattering of light is called “Rayleigh” or elastic scattering due to an energy difference of zero since the frequency of light emitted is the same frequency of the incident light. However due to the molecular vibrations of the molecule, variations in the molecules polarizability occur. This is best represented through the classical harmonic oscillator model for a diatomic molecule. A Taylor series expansion for the diatomic polarizability as a function of its vibrational coordinate sets a basis for understanding the variations of the polarizability. Using the first order approximation relative to the equilibrium position:
α=αo+(∂α∂Q)oQ
Q=Acos(2πνit)
Through back-substitution of Q, α and  into
into  the following result appears:
→μinduced =αo→E+(∂α∂Q)o[Acos(2πνit)][Eocos(2πνot)]=αo→E+(∂α∂Q)oEo[Acos(2πνit)][cos(2πνot)]=αoEocos(2πνot)+(12)(∂α∂Q)oEoA[cos(2π(νo+νi)t)+cos(2π(νo−νi)t)]
The result of this harmonic oscillator approximation results in three key scattering processes, the first term is the Rayleigh scattering described above, however two interesting processes appear. The ( ) term indicates an increase of frequency by νi from the Rayleigh scattering, this term is named “anti-Stokes” Raman scattering, while the (
 ) term indicates a decrease of frequency by
  , this term is named “Stokes” Raman scattering.2 Stokes and Anti-stokes Raman Scattering are defined as inelastic scattering of the incident light frequency, and the intensity of these shifts in the visible region are much smaller than that of the incident light. These shifts can be seen on an energy level plot below:

Quantum Model
The quantum mechanical explanation for Raman scattering arrives at the same conclusion as the classical model, but with the wave functions of the molecules. A brief explanation of the relative intensities of the Stokes and anti-Stokes Raman frequencies is explained through the occupation of the v=0 and v=1 vibrational quantum states. As shown in Figure 5.9.1, it can be seen that Raman anti-Stokes populates the v = 1 state at room temperature and the Raman Stokes populates the v=0 at room temperature. At room temperature, the relative population of these states is expressed through the following ratio:3
Nν=1Nν=0∝e−ΔE/kbT
In a equilibrium state and at room temperature, the ratio of v = 1 to v = 0 will be very small, due to the Boltzman exponential, which means almost all of the possible states are in the ground state. This helps draw the conclusion that because mostly all of the states are in the ground state, then the Raman Stokes frequencies will be greater populated and thus have a greater intensity than the anti-stokes Raman frequencies. The symmetry of a molecule is directly proportional to the allowed transitions between two vibrational energy levels in the expected Raman spectrum. These allowed transitions are dictated by the selection rules, meaning the matrix element of polarizability between two states. In braket notation:4
⟨ψo|α|ψ1⟩>=∫ψ∗0αψ1dQ
If the matrix element is zero, the polarizability is a constant and thus it will be independent of vibrations along the coordinate.4
In contrast with Infrared Spectroscopy, the matrix element for transitions between states is dictated by the dipole moment operator,  and the same rules apply. However, there is a rule in which the Raman and Infrared spectra can be differentiated through molecules that have an inversion center. When a molecule under goes an inversion operation, the electric dipole moment operator changes sign, which leads to (x,y,z) becoming (-x,-y,-z). However, the polarizability does not change when under inversion, so a molecule with an inversion center that has observed vibrations in the infrared spectrum, will not be observed in the Raman spectrum and vice versa.1
Group Theory and Vibrational Modes
Symmetry plays a huge role in deciphering the structure of a molecule when using an Infrared or a Raman spectrum. By using group theory, the number of vibrational, rotational and translational modes can be determined which can then be referenced to the character table of the point group of the molecule. For any molecule, the number of vibrational modes is equal to:
Vibrational Modes={3Natoms−6 if molecule is non-linear 3Natoms−5 if molecule is linear
In order to determine the vibrational modes, the point group of the molecule must be determined and each atom in the molecule will be assigned a Cartesian coordinate axis. Each point group has its own collection of symmetry operations and this is represented through a character table.5 In the character table there are symbols, called Mulliken symbols which represent how a molecule is transformed under the operation of the symmetry elements. Mulliken symbols can have characters like “A1” which represents a completely symmetric species and with each Mulliken symbol, the number of Infrared or Raman peaks can be identified. Infrared peaks are closely correlated with translational (x,y,z) and rotational (Rx,Ry,Rz) coordinates, while the Raman peaks are correlated with tensor coordinates (xy,yz,xz, x2– y2,.. etc). After a molecule under goes the symmetry operations, the total number of Mulliken symbols will be tabulated in order to form a reducible representation. The reducible representation is then subject to become an irreducible representation through the following formula:5
ni=1h∑cxixr
Where ni is the number of Mulliken symbols, h is the total number of symmetry operations, gc is the total number of symmetry operations of that specific type, ci is the character of the irreducible representation and cr is the character of the reducible representation. From this irreducible representation, the number of translational and rotational modes can be subtracted and the total number of vibrational modes will be found. Additionally, in the vibrational modes there are possibly two types of motions that can be deduced, these are the bending and stretching modes. Stretching modes can be found by assigning a vector to the length of a bond of interest in the molecule, and performing the symmetry operations to determine a irreducible representation. The bending modes could then be found via subtraction of stretching modes from the total vibrational modes.5
Due to the symmetry of a molecule, the polarizability which is a second rank tensor has different shapes.
(αxαyαz)(αxαyαz)=(αxxαxyαxzαyxαyyαyzαzxαzyαzz)
The polarization ( ) can now be written in matrix form:
(αxxαxyαxzαyxαyyαyzαzxαzyαzz)(ExEyEz)=(PxPyPz)
By diagonalizing the polarizability matrix, there are only three polarizabilities that are non-zero along the principle axis of the molecule and depending on the symmetry the polarizability elements may or may not equate. An important aspect of polarization experiments in Raman Spectroscopy is the ability to depolarize the scattered Raman light. Completely symmetric stretches like “a1” will be strongly affected when the incident light is orthogonal to the intensities of the scattered light. This depolarization of the scattered light will be evident in the relevant intensity ratios between Raman spectra of the depolarized spectrum and polarized spectrum.5
Common Lipids
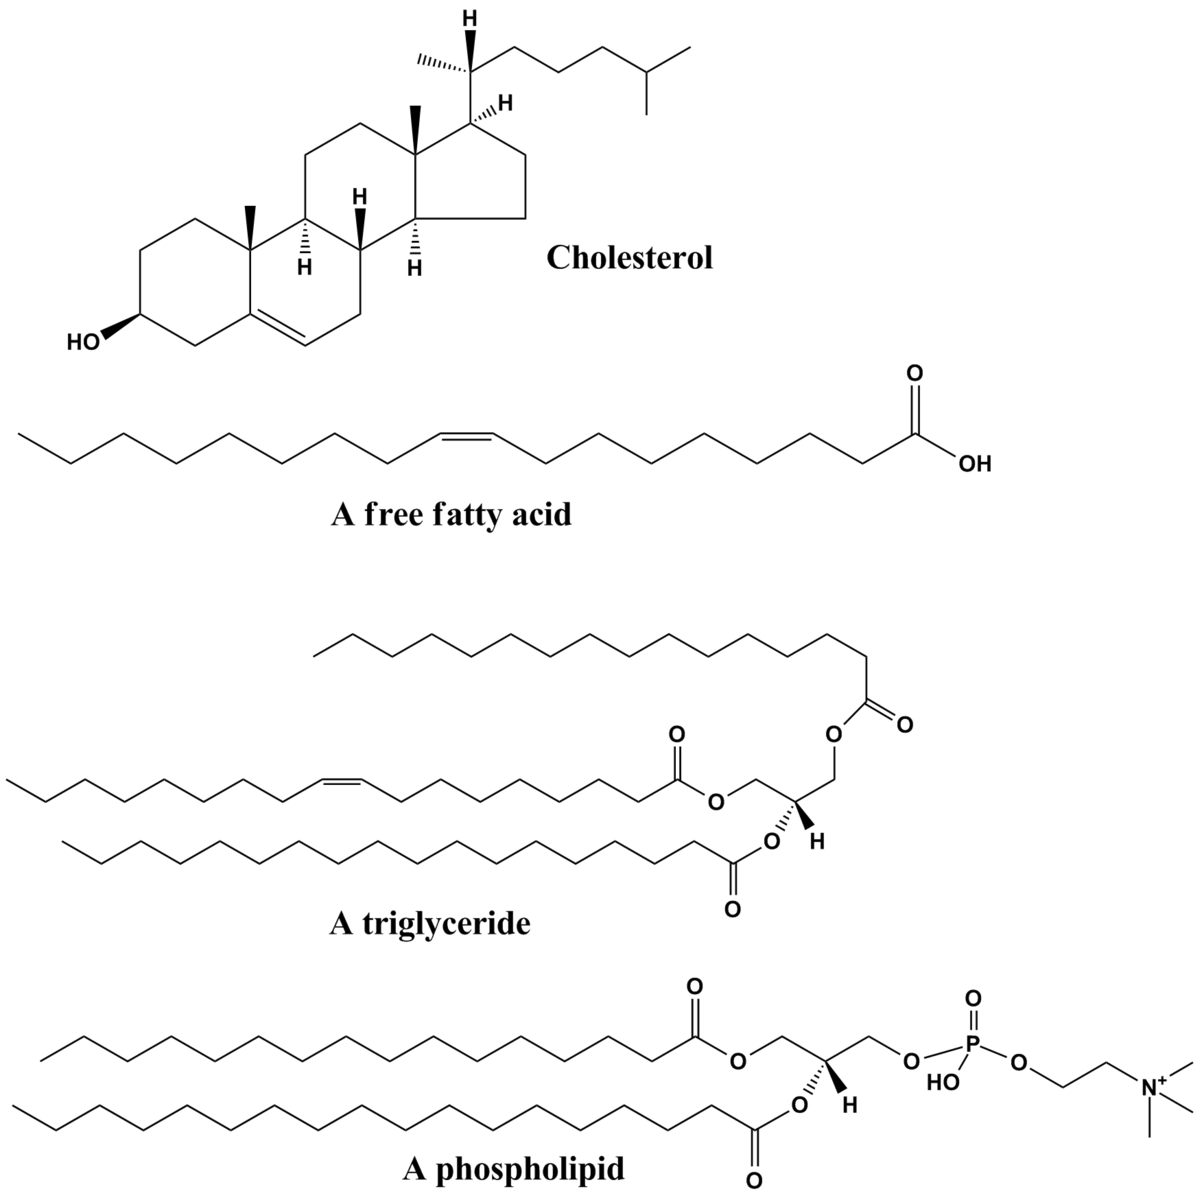
There have been countless amounts of molecules studied through their vibrational Raman shifts, this includes organic, inorganic, polymeric molecules and biochemical compounds. Biochemical compounds of interest like lipids have been studied and their corresponding Raman shifts have been characterized. Lipids are characterized as oily molecules that are soluble in non-polar solvents and are not miscible in water. Some common lipids that can be studied are Cholesterol, saturated and fatty acids, Triglycerides and Phospholipids and many more. Cholesterol, which is apart of the Sterol structural class is recognized by the fusion of three six-membered rings and a five-membered ring. Cholesterol is amphipathic and is characterized with a polar head group (hydroxyl) and a non-polar hydrocarbon body. These sterols have both a structural component in membranes and also as precursors to the synthesis of a variety of steroid complexes.6 Free-fatty acids as shown in Figure 5.9.2, have common derivatives like fat and oils and are characterized by a terminal carboxylic acid functional group and a fatty acid tail. The degree of unsaturation in the tail dictates many different properties and are classified as unsaturated and saturated fatty acids. Triglycerides are the product of esterification which are characterized by three fatty acids covalently bonded to each of the three hydroxyl groups in Glycerol. If the polar head group is chemically bound via a phosphodiester linkage then a phospholipid is formed.6 Triglycerides and Phospholipids are very common in food items such as olive oil, butter and even beer fat. The different chemical properties, like melting points are all dictated by the identity of the non-polar tails of the molecules. Generally, if an oil is composed of unsaturated tails (double bonds) then the oil will be solid at room temperature, and if the oil is completely of saturated tails then the oil will be in the liquid state.6
Raman Modes in Fatty Acid Methyl Esters (FAME)
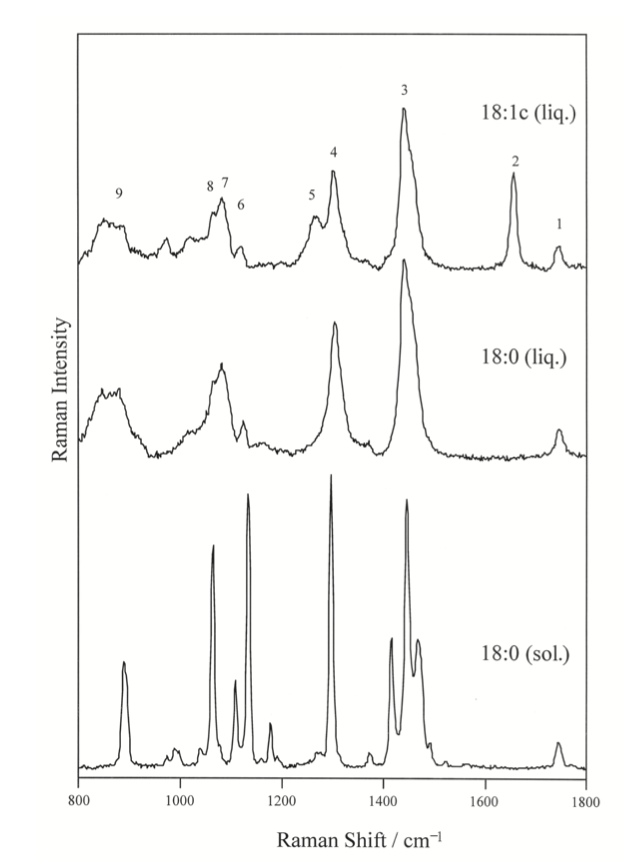
Raman spectroscopy can be used on these types of lipids in order to distinguish between lipids of different carbon counts. Below in Figure 5.9.3, are Raman spectra of unsaturated (oleic acid, 18:1), saturated (stearic, 18:0) and Fatty Acid Methyl Esters (FAME) as solids(sol).7 It can be seen in the Raman spectra that there are quite a few characteristic peaks in this frequency range that is common in organic chemistry, these common peaks are summarized and assigned in Figure 5.9.4 below.

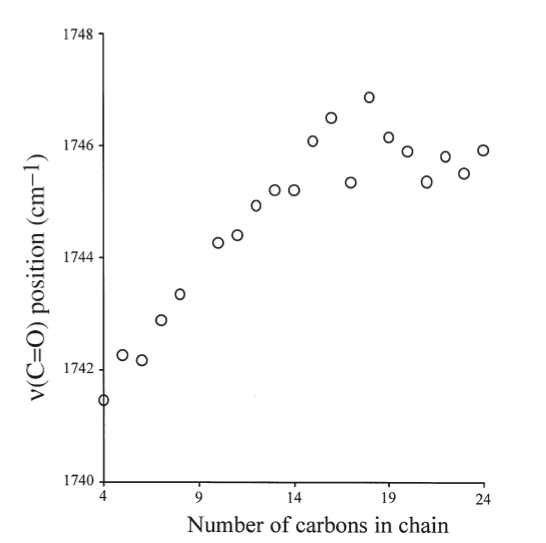
Raman frequencies corresponding to different vibrational modes that was partly described in the group theory section, can be determined from the spectrum and chemical structure. One of the most notable stretching modes that is generally looked for in a spectrum is the carbonyl stretch (C=O) in the wave number range of ~1730 to 1750 cm-1.7 This is generally the most followed stretching mode because it is easy to identify on a spectrum and generally there is only one carbonyl in a fatty acid molecule. Because of the uniqueness of the carbonyl stretching frequency for each different FAME molecule, the identity of an unknown FAME molecule can be known if the Raman spectrum is known. This experiment was performed on different FAME molecules with different numbers of carbon in the Fatty Acid Tail, the resulting curve is shown in Figure 5.9.5. This experiment shows that as the number of carbons increase in a tail, the stretching frequency for the carbonyl in FAME molecules generally follow and increasing trend. This is an important result, because the identity FAME molecule can be found by measuring the Raman spectrum and referencing the carbonyl stretching frequency.7
Summary
- Raman Spectroscopy involves the inelastic scattering of light on a molecule and how the tabulation of these values leads to vibrational shifts which are unique for each molecule.
- The expectation value of the polarizability decides whether a vibrational transition will occur or not.
- The number and identify of the vibrational mode(s) of a molecule can be determined by utilizing group theory relationships.
- Raman Spectroscopy can be applied to biological molecules of interest, especially lipids.
References
- en.Wikipedia.org/wiki/Raman_spectroscopy (accessed May 18, 2018)
- Shoemaker, D. P.; Garland, C. W.; Nibler, J. W. Experiments in Physical Chemistry; McGraw Hill: New York, NY, 1989.
- McQuarrie, D. A.; Simon, J. D. Physical chemistry: a molecular approach; Univ. Science Books: Sausalito, CA, 1997.
- Sakurai, J. J. Modern quantum mechanics: revised edition; Pearson Education: Delhi, India, 2006.
- Miessler, G. L.; Fischer, P. J.; Tarr, D. A. Inorganic chemistry / Gary L. Miessler, Paul J. Fischer and Donald A. Tarr; Pearson: Boston, 2014.
- https://en.Wikipedia.org/wiki/Lipid (accessed May 18, 2018).
- Beattie, J. R.; Bell, S. E. J.; Moss, B. W. Lipids 2004, 39 (5), 407–419.
- Czamara K., Majzner K., Pilarczyk M., Kochan K., Kaczor A., and Baranska M. (2014) Raman spectroscopy of lipids: A review, J. Raman Spectrosc., 46; pages 4–20, doi: 10.1002/jrs.4607.