
2.2: Activities


- Last updated
- Nov 8, 2022
- Save as PDF

( \newcommand{\kernel}{\mathrm{null}\,}\)
Things You Will Need
- several 812×11 sheets of paper
- a ruler
- a marble (steel or glass), or a coin
- (useful, but not necessary) carbon paper
- something to use as an inclined plane (clipboard, three-ring binder, sheet of cardboard, etc.)
The Problem
A bitter controversy has recently broken out between the residents of a new housing development in the foothills and the Town Council over the safety of a number of large rocks perched on the slope of a hill that ends with a cliff, down to a lake, on the opposite side of which is the housing development. At the heart of the dispute is the relationship between the height above the edge of the cliff at which the rocks are balanced (y) and the distance, horizontally from the base of the cliff, to which the rocks will range (R) should they roll down the hill and fly off the cliff. Neither party is convinced by fancy physics calculations, so they both hired engineering firms to conduct modeled experiments to come to a conclusion.
Figure 2.1.1 – Engineers' Model
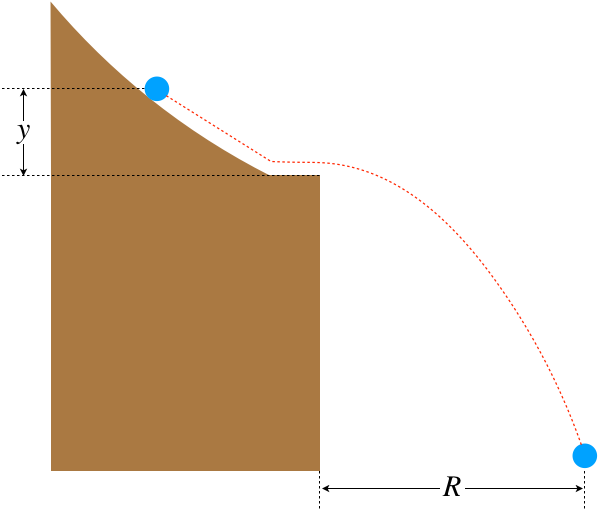
One group of engineers concluded that y and R are related by:
y∝R
A second engineering firm concluded that y and R are related by:
y∝R2
Further calculations reveal that if the trajectories obey the linear relation, then some of the rocks starting higher on the hill will fly over the lake and land within the housing development, but if the quadratic relation holds, then even the highest rocks on the hill will land in the lake, leaving the housing development undamaged.
Your Task: Set up the same experiment performed by the two engineering firms, and use the graphical technique discussed in the Background Material to draw a conclusion about which of the two relationships given above is the correct one.
Data Collection
The general procedure to this experiment should be clear: Release the marble from different heights on the ramp, and record their landing points. Make plots of y against the two proposed functions of R, and determine from a best-fit line which of these functions is the relationship between y and R that is more likely to be correct. There are several considerations to keep in mind for the data-taking process itself:
- Unlike the previous lab, a small stone is unlikely to work here, as it may not roll very predictably down the plane. If a small sphere is not available, this can be done with a coin on edge. The only mildly-challenging part is releasing it from rest such that it rolls and doesn't fall over.
- Recording the landing points of the marble/coin will work exactly like the previous lab, but the range of heights from which it is released may lead to a spread of points that goes beyond a single sheet of paper, so several sheets placed end-to-end may be needed. You will want to do "warm-up runs" from the range of heights you plan to use, to make sure that your paper covers the full range of landing points.
- As our goal is to measure distances from the edge of the "cliff," we will need to have a line on the paper that indicates the edge of the cliff. Think about how you would most accurately determine that line (is "eyeballing it" a good idea?).
- There is variance in each roll, even from the same height, so perform 4 rolls from each height and use the "averaging" method from the previous lab to determine the landing points. There is no need to compute uncertainties for this lab.
- Keeping control over the experimental conditions is important, so pay close attention to the following:
- Make sure the ramp is stable, so that it doesn't shift or change its angle between runs. The ramp should also end before the edge of the tabletop. That is, this model assumes that the rock is moving horizontally when it leaves the cliff.
- The ramp doesn't need to be flat (it is only the starting height of the marble above the tabletop that matters), and the data is likely to be "cleaner" if the marble/coin makes a smoother transition from ramp to table. It won't be a disaster if there is a small bounce at this transition point between the ramp and the table, so don't go too far out of your way to make this transition smooth – just don't use an extreme angle for the ramp and it should be fine.
- Make sure that the paper remains held in place on the floor for all runs, either by taping it there, or placing weights on the corners.
- The measurement of the height above the tabletop will be hard to do with any precision, and it is especially tedious to measure individually every time you do four runs at the same height, so it is a good idea to measure one time and mark the starting point on the ramp, then release from that point 4 times.
- Try to keep the side-to-side variance as small as possible, and keep in mind that it is the distance from the edge of the cliff that matters, not the distance from a single point (i.e. the exit point from the tabletop will not be exactly the same with every run).
- To make sure that you have sufficient data to discern a curve in the plot, make measurement for at least 5 different starting heights.
Data Analysis and Additional Discussion
Once you have collected the sets of dots on your papers, do the following:
- Create a table like that shown in Figure 2.1.2, and use it to create plots for the two competing theories.
- Interpret your results – explain which theory is correct according to information you can draw from your plots.
- Describe what assumptions were made that might invalidate the result if they turned out to be wrong.
- Briefly discuss the likely sources of error in your experiment, including the following considerations:
- how the procedure can be improved to give cleaner results
- the likelihood that the errors could have led to an inaccurate conclusion
- (optional) Feel free to confirm your conclusion with the "fancy physics calculations" that your clients don't trust.
Lab Report
Download, print, and complete this document, then upload your lab report to Canvas. [If you don't have a printer, then two other options are to edit the pdf directly on a computer, or create a facsimile of the lab report format by hand.]