2.4: What a Spectrum of Light Can Tell Us About Matter


( \newcommand{\kernel}{\mathrm{null}\,}\)
- You will be able to describe how light can be measured as a function of energy (spectroscopy).
Some students are discussing a demo they recently saw in their class.
- Demaryius: "I loved seeing the rainbows in class today— that was so cool!"
- Eugenia: “Well, they weren’t really rainbows— they were spectra. But I agree that they are cool.”
- Frank: “What’s the difference?”
- Eugenia: “Spectra are when light is spread out over all of its different energies when it passes through some kind of scientific instrument. So I think spectra is the technical term for rainbow.”
Do you agree with any of these students and if so, whom?
Demaryius
Eugenia
Frank
None
Explain
Have you ever looked through a prism on a sunny day? Seen a rainbow reflected off a piece of jewelry or glass? Did you know that gorgeous rainbow of colors was already present in the sunlight before you held up your prism? All the prism did was spread the light out into a spectrum of different wavelengths, as shown in Figure 2.4.1a.
By looking at the spectrum of light from an object, we can learn a wealth of information about the conditions of the object that produced the light, for example, its temperature, density, and composition. For this reason, spectroscopy, the study of spectra, is used in many sciences, including biology, geology, chemistry, and forensics, not just astronomy and physics. The term “spectrum” refers to how many photons are being emitted at each frequency (or wavelength or energy); it is just a fancy term to describe the distribution in energy. A familiar example of a distribution might be that of the grades in a class. The grade distribution describes how often each score occurred (i.e., how many students in the class received each score). In a similar manner, the spectrum of a light source describes how many photons of a given frequency (or wavelength or energy) the source is emitting. A spectrograph is the scientific instrument used to obtain a spectrum; a schematic of one is shown in Figure 2.4.1b.
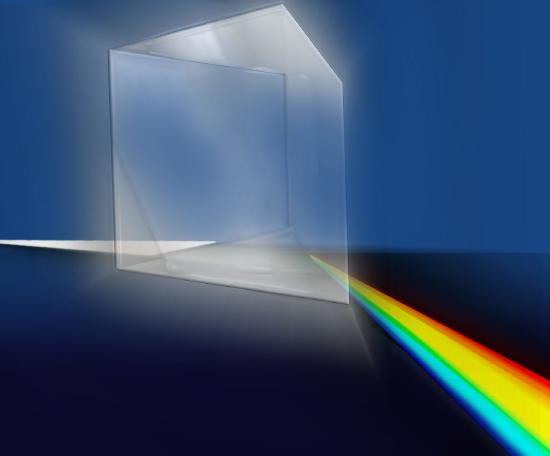
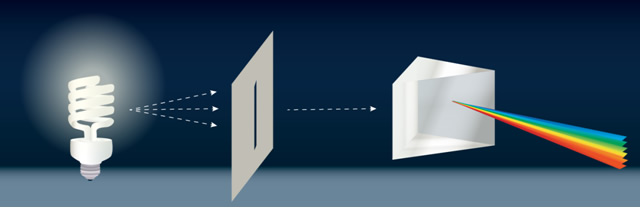
Figure 2.3 Prism and simple spectrograph (spectroscope). (a) A prism causes white light to be spread into its various colors because the different wavelengths of light have different speeds while they travel through the prism (different wavelengths travel at the same speed in a vacuum, but not otherwise). (b) Light enters a spectroscope through a small opening, such as a slit, and is then split into its constituent wavelengths by a prism-like device (which is usually a grating) so that each wavelength can be studied independently. The study of spectra has allowed astronomers to learn a tremendous amount about the Universe. Credit: NASA/SSU/Aurore Simonnet.
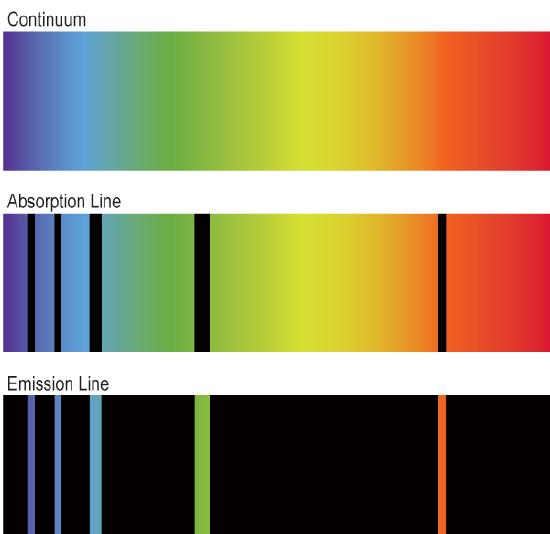
Some of the different distributions you might see include continuous spectra, emission-line spectra, and absorption-line spectra. Continuous (or continuum) spectra show continuous emission (no gaps) at all frequencies, or at least over a broad range of frequencies. Absorption-line spectra feature a bright continuum plus dark lines; something has absorbed light at very specific frequencies, taking those out of the mix. Emission-line spectra consist of bright lines on a dark background; the source is emitting light at very specific frequencies. See Figure 2.4.2 for illustrations of continuous, absorption, and emission spectra.