
8.4: Velocity and Mass Distributions in Galaxies


( \newcommand{\kernel}{\mathrm{null}\,}\)
Login with LibreOne to view this question
NOTE: If you typically access ADAPT assignments through an LMS like Canvas, you should open this page there.
Up to this point, we have explored how velocities of rotating objects can (or not) vary with radius, or distance from the center of the system. We have seen how mass can (or not) vary with radius, too. We have explored ways to model mass and velocity distributions using equations, expressions of proportionality, and graphs. We have also seen how mass distributions and velocity distributions are related according to the effects of gravity. We looked in detail at how mass can be modeled in the Solar System, and how the Solar System rotates (or in other words, how the planets orbit the Sun) due to gravity.
But what does all of this have to do with dark matter? In this section, the connection to dark matter will start to become clear. Here, we will discuss how objects orbit within galaxies and what that tells us about galaxy masses.
Observing Rotation Curves of Disk Galaxies
To begin, we will consider spiral galaxies. Spiral galaxies (like the Milky Way Galaxy) are large systems that typically have three distinct components (see Figure 8.8): The first is the flat disk that contains stars, gas, and dust, and that is most prominent when we look at these galaxies in visible light. You will not be surprised to learn that this is called the disk component. The second component is a sphere-shaped collection of stars near the galaxy center. It is called the bulge, or sometimes the central bulge. Finally, there is a much larger sphere-shaped collection of stars and star clusters extending out at least as far as the disk, called the halo. The halo is much larger in extent than the bulge, but there are not very many stars in it compared to the number of stars in the bulge or disk. The number of stars is so low, in fact, that galaxy halos are nearly invisible. We tend to look right through them.
All of this material is held together by the mutual gravitational attraction of all the material within the galaxy.

How do we measure the orbital speeds of the stars and gas within a spiral galaxy? First note that because the bulges and disks of spiral galaxies are so much brighter than their halos, we mainly concentrate on measuring the orbital speeds of the stars and gas in those components of spiral galaxies.
The stars and gas in the disks of spiral galaxies tend to rotate around the center of the galaxy. If the galaxy is “face-on” from our vantage point, we will not be able to observe its rotation. On the other hand, if the galaxy is “edge-on,” we can measure the rotation through redshift and blueshift. For an edge-on, rotating spiral galaxy, we will observe redshift on the side of the galaxy that is rotating away from us (the light will appear to be “stretched out,” and will appear to have longer, redder wavelengths). We will observe blueshift on the side of the galaxy that is rotating toward us (the light will appear “scrunched” and will appear to have shorter, bluer wavelengths). See Figures 8.9 and 8.10 for more on how we observe rotation in galaxies.

One might think astronomers would study the stars in galaxies to learn about the motion within galaxies. Stars are bright, and there are many of them throughout a galaxy. For very nearby galaxies, we can measure the motions of stars. However, gas is also spread throughout the disk of a spiral galaxy. This gas provides a bright emission spectrum at specific optical wavelengths, as well as bright emission at a particular radio wavelength (21 cm). At these wavelengths, the gas within a spiral galaxy actually emits more light than stars. Also, if we take spectra at different distances out from the center of the galaxy, we will have measurements that can tell us about the motions of the gas at different radii from the galaxy’s center. We can do this by placing a slit over the galaxy that blocks out all the light except from a thin strip along the length of the galaxy. This way, we can measure motions only from the light that makes it through the slit, as shown in Figure 8.10.

For nearby galaxies astronomers must take many individual measurements if they want to make a complete rotation curve, or velocity-distance plot. Nearby galaxies are fairly large in the sky, often larger than the field of view of a telescope. As a result of their large apparent size it is not possible to view them in their entirety with a single exposure. Instead, separate observations must be made across the galaxy, each at a different distance from its center. This is a time consuming process.
Perhaps paradoxically, motions are easier to measure in distant galaxies. When a galaxy is distant enough to lie completely within the telescope/camera field of view, then a spectrograph slit can be laid down to coincide with the long axis of the galaxy, allowing a complete map of velocities for the entire length of the system to be collected at once.
Whichever method astronomers use, the end result is the sort of spectrum shown in Figure 8.10 above. It shows the rotation velocity of a disk galaxy versus distance from the center of the galaxy. Such plots are rotation curves, just like the rotation curves you graphed and studied earlier in the chapter.
In this activity, you will obtain a rotation curve for a spiral galaxy by moving a slider over the image of the galaxy.
To move the slider, click and drag the line under the red “button.” Move the slider to each location where you would like to make a measurement, then click the red button. (Alternatively you can drag the slider with the button, and when you release the button, it will trigger a measurement.)
Choose at least five points on each side of the galaxy’s center. At each point, the calculations are done to find the rotation speed of the gas in the galaxy. This is done by comparing the measured value of the H-alpha emission line to its laboratory value and applying the Doppler relation to the shift.
Login with LibreOne to view this question
NOTE: If you typically access ADAPT assignments through an LMS like Canvas, you should open this page there.
Match the images of the galaxies on the left with the rotation curves shown on the right.
For each galaxy image, the relative velocities at three different locations are indicated by the length of the arrows.
Click and drag each image to the square next to the rotation curve that provides the best match. When you have made a correct match, you will see a green check mark in the upper right corner of the galaxy image.
Missing Mass (Dark Matter)
From your work in the last activity you may have noticed that rotation curves for spiral galaxies have two parts. In the first part, close to the center of the galaxy, the rotation velocity increases directly with radius, \(v \propto r\). This is the rotation curve of a rigid disk (see Section 8.1.1). However, galaxies are not rigid, they are collections of separate objects, and their rotation is determined by how those objects (and their masses) are distributed. The distribution of mass that goes with this curve is the one in which mass is evenly spread out; refer to the models from Section 8.3,.
However, the rotation curve does not follow this model very far. It soon “turns over,” or stops increasing, and the velocity is then constant out to the edge of the visible galaxy. In other words, in the outer regions of the galaxy disk, v = constant. Again following from our work in Section 8.3, we know that a constant velocity indicates that in this outer region of the galaxy, the galaxy’s mass must be increasing directly with radius. If we double the distance from the center of the galaxy, the mass enclosed within the radius also doubles. This is a surprise.
Why? If you look at a typical spiral galaxy, you will see that it has a bright center, and that its brightness gradually decreases toward its outer regions. This trend of brightness with radius is true for all spiral galaxies. The rapid decrease of the brightness in spiral galaxies creates a puzzle. If we assume that most of the mass of a galaxy is made up of stars, we would assume that most of the galaxy’s mass is distributed toward the center of the galaxy, in the parts of the galaxy where those stars are more numerous. At very large radii (large distances from the center of the galaxy), the mass of the galaxy should still increase because the orbit would enclose more stars. However, as we got farther away from the center of the spiral galaxy, the radius would not enclose very many more stars, and the increase in mass (at these large radii) should be small.


Instead, the rotation of the galaxies implies that the mass is increasing rapidly with radius. There do not seem to be enough stars present in the outer regions of spiral galaxies to cause the rotation velocities we measure, not on their own. If we take into account only the masses of the stars we see in spiral galaxies, we expect the galaxies to rotate more slowly in their outer regions than what we measure.
An additional check on the rotation is provided by the gas in the galaxies. The gas disk of a galaxy extends out farther than the stellar disk, so it allows astronomers to measure the mass distribution of a galaxy to larger radii than stars alone do. In those far, outer regions of spiral galaxies we still see that the rotation speed of the gas is constant. This means that there is still additional mass, increasing linearly with distance from the galaxy center, even in the outer parts of the galaxy where we see no stars at all. This result has puzzled astronomers for a long time.

The shapes of galaxy rotation curves seem to be at odds with the distribution of light in the galaxies. The motions of gas and stars suggest that more mass is present than we see in the form of stars or even gas. The discrepancy is about a factor of two in the inner parts of galaxies where the main disk of stars is located. It grows to as much as a factor of 10 in the outer parts where we have only the gas disk to use as a probe.
The rotation curve anomaly was most thoroughly studied by Vera Rubin (b. 1928) and her colleagues in the 1970s and early 1980s. The inconsistency between the visible mass and the mass determined from the motion of stars and gas was originally dubbed the “missing mass” problem. Many explanations have been proposed for what this “missing mass” might be. We will discuss them later in the chapter. For now, we will note that dark matter refers to the matter in a galaxy or other system that does not emit (or absorb) any light, but which we can detect due to its mass (and gravitational effects), and which produces these puzzling rotation curves.

Observations of the rotation speed of gas in the outer regions of the Milky Way Galaxy indicate that the gas is orbiting the center of the Galaxy with a velocity of 220 km/s. Assume the gas is at a distance of 15 kpc from the center of the Galaxy.
1. How many meters from the center of the Galaxy is the gas? Convert from kpc to meters.
- Use the conversion factor: 1 kpc = 3.09e19 m
- Then: r = 15
kpc× 3.09e19 m / 1kpc= 4.63e20 m
2. What is the total mass of the Galaxy? Use the equation v2 = GM/r to calculate the total mass. Remember to convert the velocity of the gas to m/s.
- Given: v = 220 km/s = 2.2e5 m/s, r = 4.63e20 m, and we know that G = 6.67e-11 m3/kg s2
- Find: M
- Concept: v2 = GM/r
- Use algebra to solve equation for M: v2 = GM/r becomes v2r = GM
- Continue to use algebra: v2r = GM becomes v2r/G = M
- Now plug in the given numbers for v, r, and G to solve for M:
- M = (2.2e5 m/s)2 (4.63e20 m) / (6.67e-11 m3/kg s2) = 3.36e41 kg
Questions
Login with LibreOne to view this question
NOTE: If you typically access ADAPT assignments through an LMS like Canvas, you should open this page there.
Login with LibreOne to view this question
NOTE: If you typically access ADAPT assignments through an LMS like Canvas, you should open this page there.
In the above activity, you found that only a little more than half of the Milky Way’s mass is made up of stars. That leaves a lot of mass unaccounted for! We must also recognize that the calculation above is a very rough approximation. For example, we made the assumption that every star in the Milky Way has the same mass as the Sun; however, most stars in the Galaxy have smaller masses than the Sun, and some have much larger masses than the Sun. Furthermore, dust within the Galaxy blocks out some of the light of the stars. Scientists who have made much more detailed calculations of the total mass of the Milky Way and its mass in stars have found that only about 10% of the Milky Way’s mass is made up of stars and other matter that emits light. That means that roughly 90% of the Milky Way’s mass might be dark matter!
Pay attention to the above example, because later in the chapter we will calculate the fraction of dark matter in another galaxy and even in a galaxy cluster.
Stellar Motions in Elliptical Galaxies
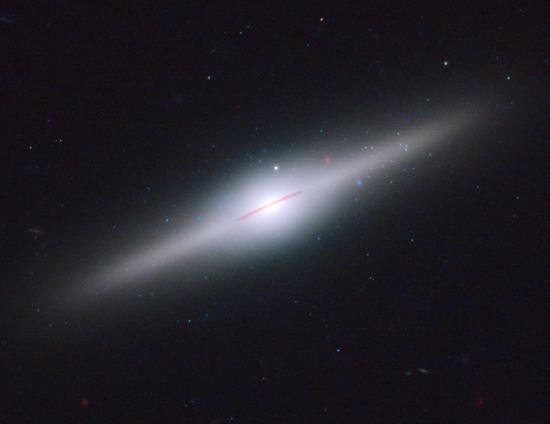
So far, we have looked at the rotation of spiral disk galaxies. These galaxies are fairly common in the Universe. The Milky Way Galaxy is a spiral, so we are motivated to study other spirals to learn more about galaxies like our own. However, we can also learn a great deal (and find still more evidence for dark matter) by studying other types of galaxies. In this Section, we will take a closer look at elliptical galaxies (see Figure 8.14).
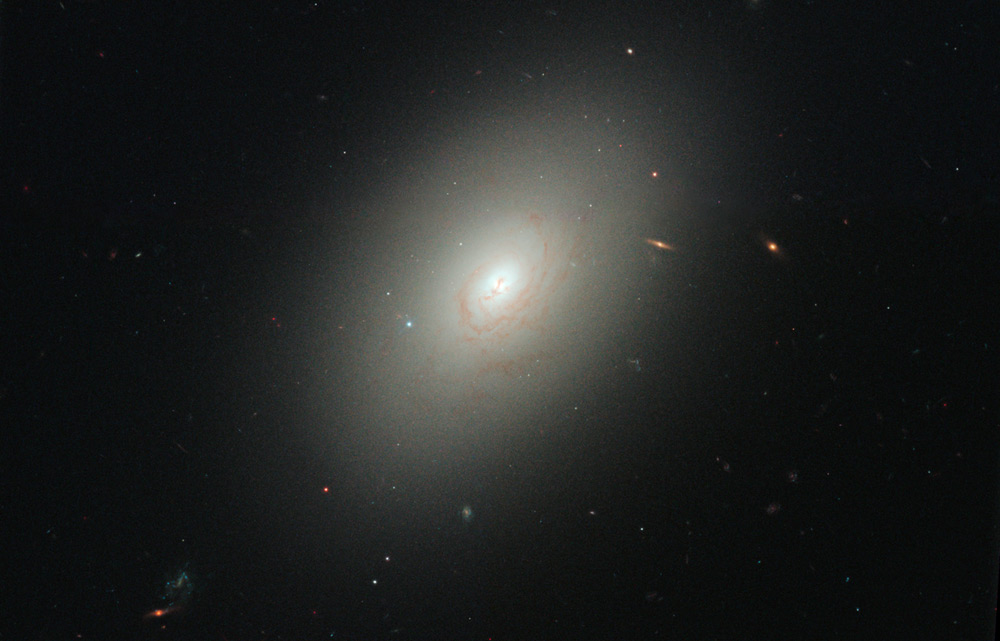.jpg?revision=1&size=bestfit&width=400)
.jpg?revision=1&size=bestfit&width=400&height=320)
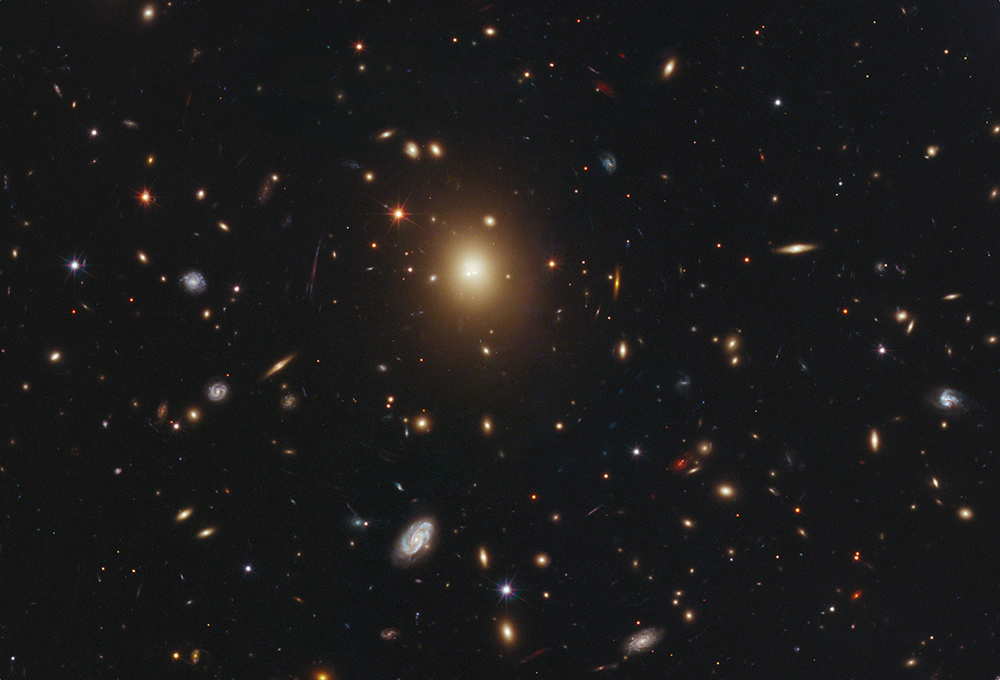.jpg?revision=1&size=bestfit&width=400)
Remember that elliptical galaxies contain mostly older stars, and little gas, so we must measure the motions of stars within an elliptical galaxy to determine the stars’ velocities and, in turn, the mass of the galaxy. Elliptical galaxies are also typically found in groups and clusters, indicating that they form when smaller galaxies, such as spirals, collide or strongly interact with each other due to gravity, as shown in Animated Figure 8.15.
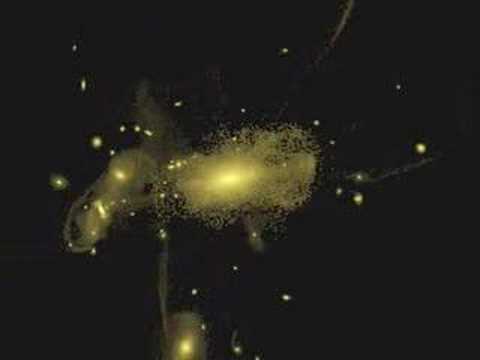
Animated Figure 8.15 Galaxy mergers. This simulation shows how an elliptical galaxy is formed when two spiral galaxies collide due to their gravitational pull on each other. Astronomers predict that the Milky Way will collide with the Andromeda galaxy (which is currently 2.5 million light-years away) in about 4 billion years.Credit: Visualization by: NASA, ESA, and F. Summers (STScI) Simulation by: NASA, ESA, G. Besla (Columbia University), and R. van der Marel (STScI)
In part due to the way that elliptical galaxies form, the motions of the stars in ellipticals are more complicated than the motions of stars and gas in spirals. Spiral galaxies rotate, but elliptical galaxies do not. Instead, their stars follow highly elliptical orbits with different orientations. This gives the galaxies their ellipsoidal shapes (like puffed-up grapes), and also their name. While spiral galaxies are supported against gravitational collapse by rotation, elliptical galaxies are supported against collapsing by the fairly random motions of their stars. Elliptical galaxies behave sort of like a gas, which is made out of molecules, except that the stars in elliptical galaxies do not ever collide with each other the way that molecules in a gas do. (Remember that there is a lot of space between stars!)
Animated Figure 8.16 Galaxy cluster interactions. This simulation shows how multiple galaxies interact due to gravity in a galaxy cluster. At the center, a massive elliptical galaxy develops. This movie helps to illustrate how the stars in an elliptical galaxy do not rotate, but instead orbit the galaxy in all different directions. Credit: Copyright © 2008 John Dubinski. Used with permission.
Stars in elliptical galaxies exchange energy through gravitational interactions rather than through direct collisions. Since higher mass galaxies have larger gravitational forces acting, their stars must be traveling at higher speeds on average to resist collapsing in toward the galaxy’s center. The speed of stars in an elliptical galaxy is related to the mass of the galaxy by the following equation:
k⟨v2⟩=GMr
or, solving for mass,
M=k⟨v2⟩rG
where ⟨v2⟩ denotes the mean-squared velocity, or the square of the spread in the velocities (the velocity dispersion) of the stars in the galaxy. The expression is nearly the same we had for rotating galaxies, aside from an extra constant, k. The value of the constant k depends on how elongated the elliptical galaxy is.
When measuring physical quantities accurately, we need to repeat the measuring procedure many times, and use statistics to help us understand the accuracy of our measurements. In the example above, we measured the velocities of many stars in an elliptical galaxy. This is similar to making repeated measurements, except that we get the information from all the stars at once, in the elliptical galaxy’s spectrum. We can use statistics to make sense of our measurements from all the stars in the galaxy, just as we would use statistics to make sense of repeated measurements in an experiment.
We will label each individual star’s velocity with a subscript i, where i=1,2….n, for n total measurements. Each velocity measurement is therefore denoted by vi. The mean velocity, ⟨v⟩, is found by adding up all the measured values of velocity, and dividing by n:
⟨v⟩=(v1+v2+v3+…+vn)/n
In an elliptical galaxy, some of the stars’ velocity measurements will be positive and others will be negative, because some of the stars are moving away from us and others are moving towards us. Therefore, we might expect the average velocity to be zero, which does not tell us much. What we really want to measure is the magnitude, or size, of the stars’ velocities, not the direction in which the stars are moving. The magnitude of the velocity is what we usually call the speed.
So, in order to find the speed, a more useful thing to calculate is the mean-square velocity. By squaring the velocity before we average it, the negative numbers will become positive, so we do not lose the information about the magnitude of the stellar motions when we add up the measurements. The mean-square velocity, ⟨v2⟩, is given by:
⟨v2⟩=v21+v22+v23+…+v2nn
Then to find the average speed of the stars, we can take the square root of this quantity, called the root-mean-square (RMS):
√⟨v2⟩=√v21+v22+v23+…+v2nn
In this example, the RMS value of the velocity provides us with the average speed of the stars in the galaxy.
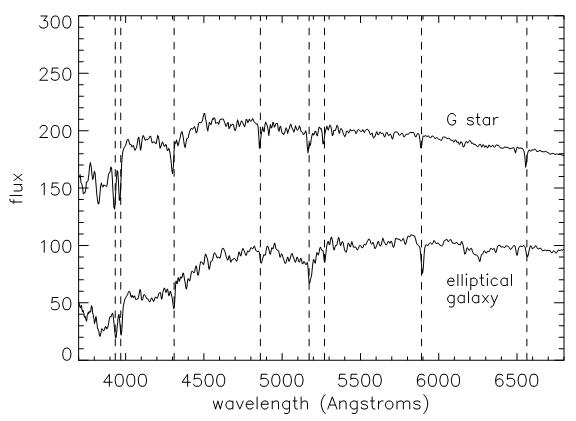
Astronomers measure the velocity dispersion by taking a spectrum of an elliptical galaxy. Unlike the case for spiral galaxies, where they usually rely on the emission signature from the gas in the galaxy to measure rotation, for elliptical galaxies they look for a signature of motion from the stars. They have to do this because ellipticals typically contain little to no gas. Stars have absorption spectra. Such spectra display dark lines where light is absorbed by the gas in the stars’ atmospheres. See Chapter 2, Sections 2.6 and 2.7 for a discussion of absorption spectra.
As we observe the random motions of the stars in an elliptical galaxy, some of the stars will be moving toward us relative to the rest of the galaxy. They will have blue-shifted absorption lines relative to the average for the galaxy. Other stars will be moving away from us, so their absorption lines will be red-shifted. Since all of these stars will be seen through the slit of the spectrograph at the same time, all the spectral features will be overlapping. The overlapping absorption lines are seen as broadened lines, and the width of the lines are related to the mean-square stellar speeds as shown in Figure 8.17. The interactive activity that follows illustrates how this works.
In this activity, you will use an adjustable Gaussian fitting tool to determine the width of an absorption line in the spectra of three different elliptical galaxies.
First, click on one of the galaxy images at the top. The spectrum of the galaxy will appear. Notice that the spectrum has an absorption line, or a big decrease in brightness at certain wavelengths.
In order to see the Gaussian line fitting tool to measure the width of the absorption line, click on the box that says “Show Gaussian” above the spectrum.
The tool has a horizontal adjustment and a vertical adjustment. The horizontal adjustment has two large white dots: the dot on the left can be used to move the tool away from its initial position on the y axis. The dot on the right can be used to change the width of the Gaussian shape. The smaller dot on the vertical axis of the tool can be used to change the depth of the Gaussian shape.
Carefully fit the shape of the absorption line using the tool. The Gaussian fitter will read out the following information: the central (mean) wavelength of your Gaussian fit, and the width (sigma, related to a mean-square measurement) of your Gaussian fit in wavelength and in velocity. Once you are satisfied that you have fit the shape well, read the number under “sigma (velocity)”. This is the velocity dispersion of your galaxy. Record the number in the table below. Repeat for each galaxy.
Login with LibreOne to view this question
NOTE: If you typically access ADAPT assignments through an LMS like Canvas, you should open this page there.
Observations of the motions of stars in an elliptical galaxy have provided a velocity dispersion measurement of 200 km/s. Assume the measurements are made within a radius of 20 kpc from the center of the galaxy. You may find the worked example at the end of Section 8.4.2 helpful as you do this calculation.
Questions
Login with LibreOne to view this question
NOTE: If you typically access ADAPT assignments through an LMS like Canvas, you should open this page there.
Login with LibreOne to view this question
NOTE: If you typically access ADAPT assignments through an LMS like Canvas, you should open this page there.
Login with LibreOne to view this question
NOTE: If you typically access ADAPT assignments through an LMS like Canvas, you should open this page there.
Login with LibreOne to view this question
NOTE: If you typically access ADAPT assignments through an LMS like Canvas, you should open this page there.
In the above activity, we see that, just as in the case of the Milky Way, elliptical galaxies contain a significant amount of dark matter. More detailed estimates of the amount of dark matter in ellipticals show that up to 95% of elliptical galaxies’ masses may be made up of dark matter. By studying stellar motions in elliptical galaxies, astronomers are able to trace the way their mass is distributed, just as they do in disk galaxies. The results they get are the same as for spirals: most of the mass in elliptical galaxies is invisible, or dark matter. The presence of this unseen matter, as revealed by the motions of matter that is seen, seems to be the rule for galaxies.