
20: Introduction to Stellar Spectra
- Page ID
- 24366

\( \newcommand{\vecs}[1]{\overset { \scriptstyle \rightharpoonup} {\mathbf{#1}} } \)
\( \newcommand{\vecd}[1]{\overset{-\!-\!\rightharpoonup}{\vphantom{a}\smash {#1}}} \)
\( \newcommand{\dsum}{\displaystyle\sum\limits} \)
\( \newcommand{\dint}{\displaystyle\int\limits} \)
\( \newcommand{\dlim}{\displaystyle\lim\limits} \)
\( \newcommand{\id}{\mathrm{id}}\) \( \newcommand{\Span}{\mathrm{span}}\)
( \newcommand{\kernel}{\mathrm{null}\,}\) \( \newcommand{\range}{\mathrm{range}\,}\)
\( \newcommand{\RealPart}{\mathrm{Re}}\) \( \newcommand{\ImaginaryPart}{\mathrm{Im}}\)
\( \newcommand{\Argument}{\mathrm{Arg}}\) \( \newcommand{\norm}[1]{\| #1 \|}\)
\( \newcommand{\inner}[2]{\langle #1, #2 \rangle}\)
\( \newcommand{\Span}{\mathrm{span}}\)
\( \newcommand{\id}{\mathrm{id}}\)
\( \newcommand{\Span}{\mathrm{span}}\)
\( \newcommand{\kernel}{\mathrm{null}\,}\)
\( \newcommand{\range}{\mathrm{range}\,}\)
\( \newcommand{\RealPart}{\mathrm{Re}}\)
\( \newcommand{\ImaginaryPart}{\mathrm{Im}}\)
\( \newcommand{\Argument}{\mathrm{Arg}}\)
\( \newcommand{\norm}[1]{\| #1 \|}\)
\( \newcommand{\inner}[2]{\langle #1, #2 \rangle}\)
\( \newcommand{\Span}{\mathrm{span}}\) \( \newcommand{\AA}{\unicode[.8,0]{x212B}}\)
\( \newcommand{\vectorA}[1]{\vec{#1}} % arrow\)
\( \newcommand{\vectorAt}[1]{\vec{\text{#1}}} % arrow\)
\( \newcommand{\vectorB}[1]{\overset { \scriptstyle \rightharpoonup} {\mathbf{#1}} } \)
\( \newcommand{\vectorC}[1]{\textbf{#1}} \)
\( \newcommand{\vectorD}[1]{\overrightarrow{#1}} \)
\( \newcommand{\vectorDt}[1]{\overrightarrow{\text{#1}}} \)
\( \newcommand{\vectE}[1]{\overset{-\!-\!\rightharpoonup}{\vphantom{a}\smash{\mathbf {#1}}}} \)
\( \newcommand{\vecs}[1]{\overset { \scriptstyle \rightharpoonup} {\mathbf{#1}} } \)
\(\newcommand{\longvect}{\overrightarrow}\)
\( \newcommand{\vecd}[1]{\overset{-\!-\!\rightharpoonup}{\vphantom{a}\smash {#1}}} \)
\(\newcommand{\avec}{\mathbf a}\) \(\newcommand{\bvec}{\mathbf b}\) \(\newcommand{\cvec}{\mathbf c}\) \(\newcommand{\dvec}{\mathbf d}\) \(\newcommand{\dtil}{\widetilde{\mathbf d}}\) \(\newcommand{\evec}{\mathbf e}\) \(\newcommand{\fvec}{\mathbf f}\) \(\newcommand{\nvec}{\mathbf n}\) \(\newcommand{\pvec}{\mathbf p}\) \(\newcommand{\qvec}{\mathbf q}\) \(\newcommand{\svec}{\mathbf s}\) \(\newcommand{\tvec}{\mathbf t}\) \(\newcommand{\uvec}{\mathbf u}\) \(\newcommand{\vvec}{\mathbf v}\) \(\newcommand{\wvec}{\mathbf w}\) \(\newcommand{\xvec}{\mathbf x}\) \(\newcommand{\yvec}{\mathbf y}\) \(\newcommand{\zvec}{\mathbf z}\) \(\newcommand{\rvec}{\mathbf r}\) \(\newcommand{\mvec}{\mathbf m}\) \(\newcommand{\zerovec}{\mathbf 0}\) \(\newcommand{\onevec}{\mathbf 1}\) \(\newcommand{\real}{\mathbb R}\) \(\newcommand{\twovec}[2]{\left[\begin{array}{r}#1 \\ #2 \end{array}\right]}\) \(\newcommand{\ctwovec}[2]{\left[\begin{array}{c}#1 \\ #2 \end{array}\right]}\) \(\newcommand{\threevec}[3]{\left[\begin{array}{r}#1 \\ #2 \\ #3 \end{array}\right]}\) \(\newcommand{\cthreevec}[3]{\left[\begin{array}{c}#1 \\ #2 \\ #3 \end{array}\right]}\) \(\newcommand{\fourvec}[4]{\left[\begin{array}{r}#1 \\ #2 \\ #3 \\ #4 \end{array}\right]}\) \(\newcommand{\cfourvec}[4]{\left[\begin{array}{c}#1 \\ #2 \\ #3 \\ #4 \end{array}\right]}\) \(\newcommand{\fivevec}[5]{\left[\begin{array}{r}#1 \\ #2 \\ #3 \\ #4 \\ #5 \\ \end{array}\right]}\) \(\newcommand{\cfivevec}[5]{\left[\begin{array}{c}#1 \\ #2 \\ #3 \\ #4 \\ #5 \\ \end{array}\right]}\) \(\newcommand{\mattwo}[4]{\left[\begin{array}{rr}#1 \amp #2 \\ #3 \amp #4 \\ \end{array}\right]}\) \(\newcommand{\laspan}[1]{\text{Span}\{#1\}}\) \(\newcommand{\bcal}{\cal B}\) \(\newcommand{\ccal}{\cal C}\) \(\newcommand{\scal}{\cal S}\) \(\newcommand{\wcal}{\cal W}\) \(\newcommand{\ecal}{\cal E}\) \(\newcommand{\coords}[2]{\left\{#1\right\}_{#2}}\) \(\newcommand{\gray}[1]{\color{gray}{#1}}\) \(\newcommand{\lgray}[1]{\color{lightgray}{#1}}\) \(\newcommand{\rank}{\operatorname{rank}}\) \(\newcommand{\row}{\text{Row}}\) \(\newcommand{\col}{\text{Col}}\) \(\renewcommand{\row}{\text{Row}}\) \(\newcommand{\nul}{\text{Nul}}\) \(\newcommand{\var}{\text{Var}}\) \(\newcommand{\corr}{\text{corr}}\) \(\newcommand{\len}[1]{\left|#1\right|}\) \(\newcommand{\bbar}{\overline{\bvec}}\) \(\newcommand{\bhat}{\widehat{\bvec}}\) \(\newcommand{\bperp}{\bvec^\perp}\) \(\newcommand{\xhat}{\widehat{\xvec}}\) \(\newcommand{\vhat}{\widehat{\vvec}}\) \(\newcommand{\uhat}{\widehat{\uvec}}\) \(\newcommand{\what}{\widehat{\wvec}}\) \(\newcommand{\Sighat}{\widehat{\Sigma}}\) \(\newcommand{\lt}{<}\) \(\newcommand{\gt}{>}\) \(\newcommand{\amp}{&}\) \(\definecolor{fillinmathshade}{gray}{0.9}\)We are about to start down a long road as we search for the chemical composition of the stars. The journey won't be short, or easy, but along the way you'll meet a number of old friends and visit some familiar places. Let's go!
Photometry yields colors and rough estimate of temperature
One of the simplest (in theory) properties of a star is its apparent brightness. Recall from our discussion of stellar "colors" that we can use the ratio of brightness measured through several filters to estimate the temperature of a star. We assume that a star emits light as a perfect blackbody,
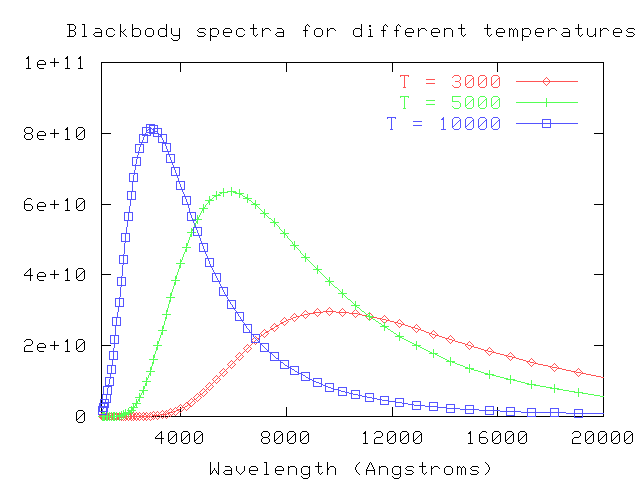
and then convolve the blackbody spectrum with the transmission functions for our filters:
.png?revision=1)
By comparing the actual ratios of the flux received from a star through each filter to the convolved ratios of various blackbodies observed through each filter, we can make a pretty good guess at the temperature of the star's outer layers. For example, look at this figure from Fukugita, AJ 120, 1072 (2000) :
This is a good first step, but it can only take us a short distance along our trip.
Astronomical spectroscopy
We can learn a lot more about stars by making much more detailed measurements of their light. When we add together all the light which passes through our atmosphere, or divide it into very large chunks by passing it through filters, we blur together a host of features. But if we send the light through a spectrograph, breaking it up into small sections by wavelength, we suddenly see that extra information.
Compare this photometric information on a star like Vega:
\[\begin{align*} B = 0.03 & &V = 0.03\end{align*} \]
to this spectroscopic information:
| lambda (Ang) | flux (W/m^2/s/m) |
|---|---|
| 4000.0 | 2.340788 |
| 4005.0 | 2.364400 |
| 4010.0 | 2.392617 |
| 4015.0 | 2.402697 |
| 4020.0 | 2.406213 |
| 4025.0 | 2.385914 |
| 4030.0 | 2.363976 |
| 4035.0 | 2.362967 |
| 4040.0 | 2.357623 |
| ( ... 400 entries deleted ....) | ( ... 400 entries deleted ....) |
| 6050.0 | 0.773777 |
| 6055.0 | 0.771288 |
| 6060.0 | 0.770566 |
| 6065.0 | 0.768194 |
| 6070.0 | 0.768426 |
| 6075.0 | 0.763557 |
| 6080.0 | 0.757481 |
| 6085.0 | 0.755058 |
| 6090.0 | 0.755177 |
It's no contest: a spectrum contains much, much more information than any ordinary photometric measurements.
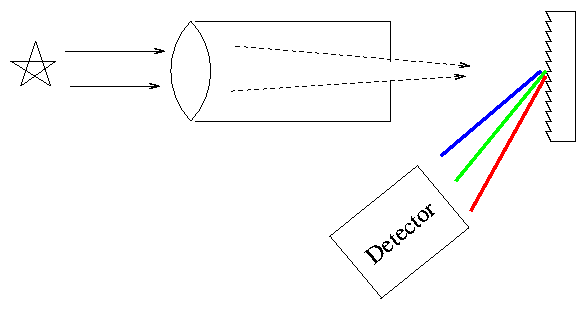
How do we acquire a spectrum? Simple. Point a telescope at a star, send the light through a prism, then let it strike a detector.
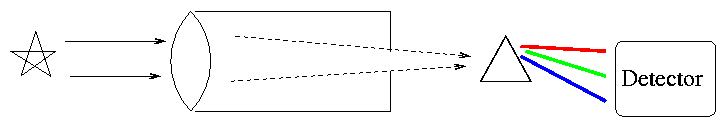
Actually, most astronomers these days (and even back in the semi-old days) use diffraction gratings instead of prisms to disperse the light.
Exercise \(\PageIndex{1}\)
Why do astronomers perfer to use gratings instead of prisms?
Absorption and emission lines
So, when astronomers first pointed their spectrographs towards the Sun and stars, they saw a rich set of absorption lines: wavelengths at which light was diminished:
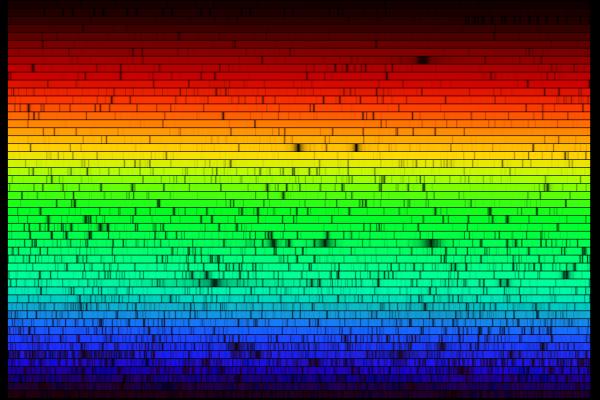
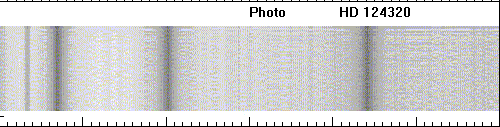
In the old days, astronomers would record spectra on photographic plates. Spectra typically were published as they appeared on the plate, showing dark lines on a relatively bright background:
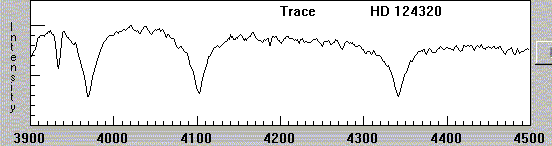
In more recent times, as astronomers use digital detectors, the fashion is to show spectra as graphs, with intensity on the vertical axis and wavelength on the horizontal axis:
What was causing these dark lines?
When astronomers pointed their spectrographs at certain non-stellar objects in the sky, especially some types of nebula, they saw a different kind a spectrum. In the words of spectroscopic pioneer William Huggins, who used his own eye as the detector,
"On the evening of the 29th of August, 1864, I directed the telescope for the first time to a planetary nebula in Draco (NGC 6543). The reader may now be able to picture to himself to some extent the feeling of excited suspense, mingled with a degree of awe, with which, after a few moments of hesitation, I put my eye to the spectroscope. Was I not about to look into a secret place of creation? I looked into the spectroscope. No spectrum such as I expected ! A single bright line only!"
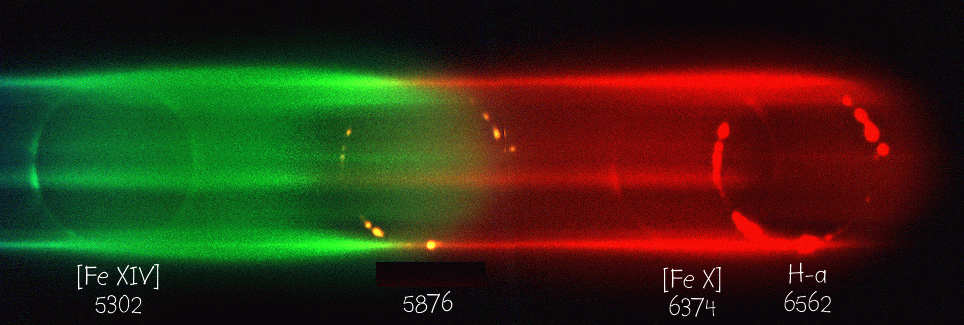
With more sensitive instruments, planetary nebulae display a number of these bright emission lines:
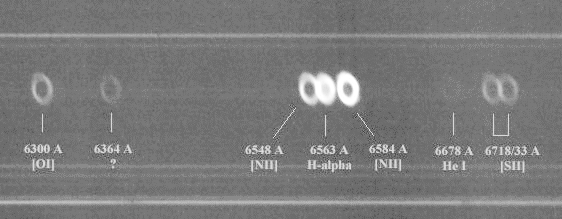
Spectrum courtesy of Christian Buil
What was causing these dark or bright lines?
Kirchoff's Laws
German astronomer Gustav Kirchoff, working in the 1850s, figured out the reason for these different types of spectra. He explained the three basic types of spectra as coming from three different situations:
- Solids, liquids, and dense gases emit light of all wavelengths, without any gaps. We call this a continuous spectrum.
- Thin gases emit light of only a few wavelengths. We call this an emission or bright line spectrum.
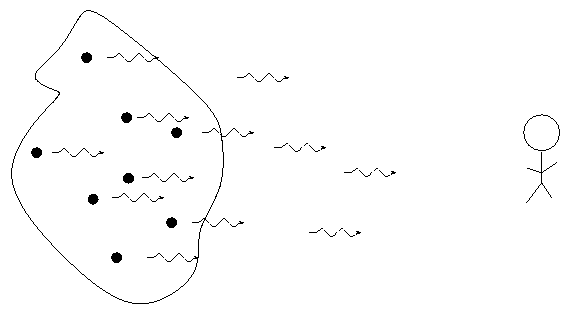
- If there is a source of light behind it, a thin gas will absorb light of the same wavelengths it emits. We call this an absorption or dark line spectrum.
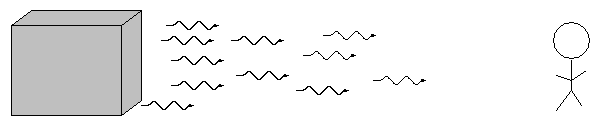
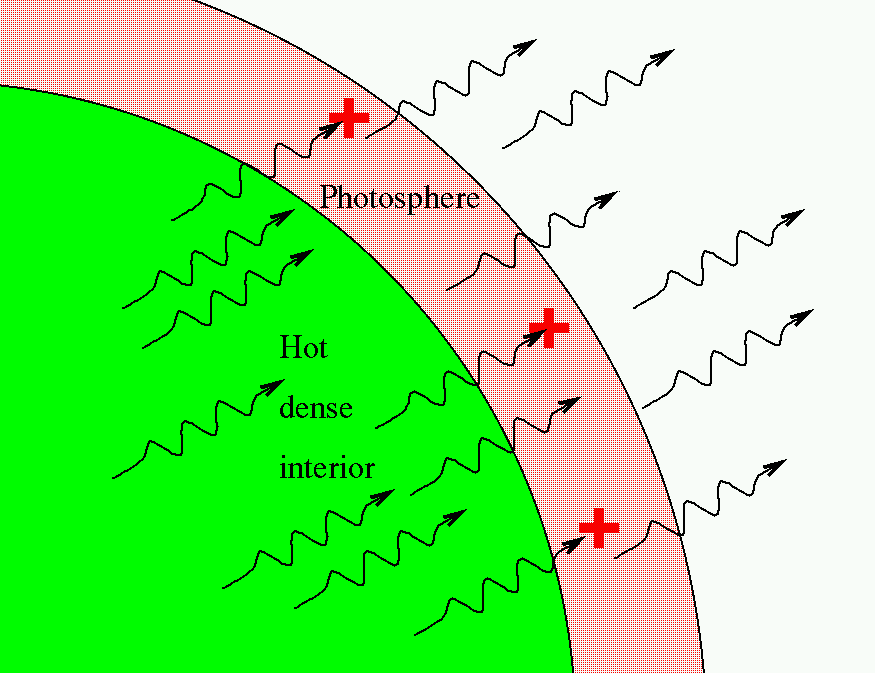
So, in the typical stellar spectrum, there must be a dense, hot source of light in the background (to create the continuum), with a tenuous, cooler layer of gas above it (to create the dark absorption lines). We call this outer layer the photosphere.
Each element (and ionization state) generates its own unique set of wavelengths of emission or absorption. For example, compare spectra of hydrogen:

helium:

and carbon:

Identifying elements in the Sun
Within a few years, scientists who studied the solar spectrum were able to identify a number of elements in the Sun by matching solar absorption lines to absorption lines formed in the lab. Some of the solar lines didn't match any found in the lab. Among these was an absorption feature in the yellow portion of the spectrum. During a solar eclipse, spectra of the outermost layers of the solar atmosphere showed this line in emission:
In 1868, English astronomer Joseph Norman Lockyer who evidently was a bit of an egotist, judging by this little poem written by one of his contemporaries:
And Lockyer, and Lockyer,
grows cockier, and cockier,
for he thinks he's the owner
of the solar corona
guessed that this line was due to an element which hadn't yet been discovered on Earth: he suggested the name "Helium", from the Greek word for the Sun. Most other astronomers thought he was wrong, and the yellow line simply due to some common element in an unusual energy state. But in 1895, William Ramsey isolated small amounts of an inert gas after processing uranium compounds. This new gas had a line at exactly the same wavelength as Lockyer had observed in the Sun -- and so it was given the name proposed for it almost three decades earlier.
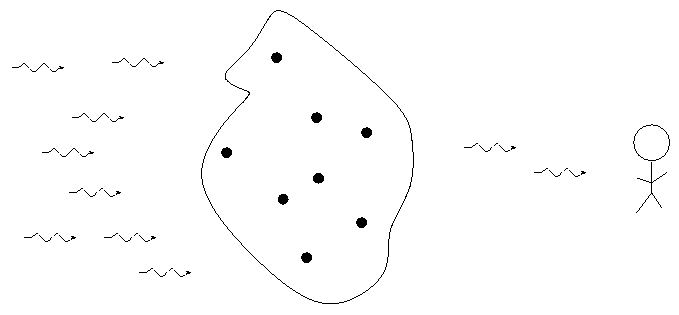
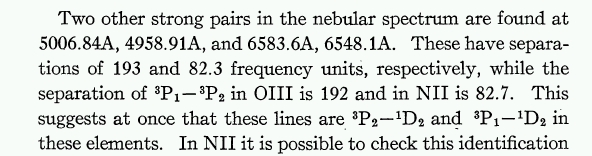
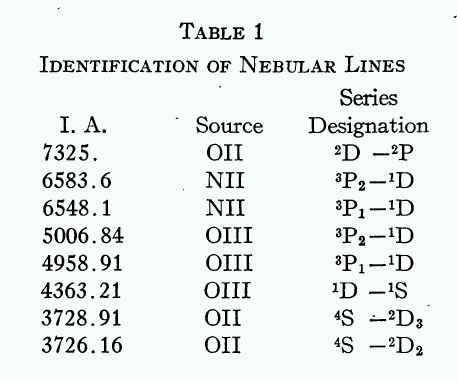
Several other spectral features in celestial objects resisted identification more effectively. In 1918, W. H. Wright at Lick Observatory assigned the names "N1" and "N2" to two emission lines seen in planetary nebulae, at wavelengths 4959 and 5007 Angstroms, respectively. He proposed that a new and unknown element, "nebulium", was responsible for these lines.
Alas, the poor element nebulium had only a short life. Only nine years later, I. S. Bowen of CalTech published a paper in which he identified the mysterious lines:

...
...
Exercise \(\PageIndex{2}\)
Why did it take nine years for scientists to realize that the spectrum of doubly ionized oxygen contains these emission lines?
Further information
- You can generate your own spectra with the MiniSpectroscopy Java Applet
- Some examples of stellar spectra are given in a future lecture on the chemical composition of stars.
- You can read a lot more about spectral analysis of light at Nick Strobel's Astronomy Note's on Spectra.
- An account of the mysterious element nebulium.
- Bowen's paper identifying "nebulium" as OIII