
21: Spectral Classification
- Page ID
- 24367

\( \newcommand{\vecs}[1]{\overset { \scriptstyle \rightharpoonup} {\mathbf{#1}} } \)
\( \newcommand{\vecd}[1]{\overset{-\!-\!\rightharpoonup}{\vphantom{a}\smash {#1}}} \)
\( \newcommand{\dsum}{\displaystyle\sum\limits} \)
\( \newcommand{\dint}{\displaystyle\int\limits} \)
\( \newcommand{\dlim}{\displaystyle\lim\limits} \)
\( \newcommand{\id}{\mathrm{id}}\) \( \newcommand{\Span}{\mathrm{span}}\)
( \newcommand{\kernel}{\mathrm{null}\,}\) \( \newcommand{\range}{\mathrm{range}\,}\)
\( \newcommand{\RealPart}{\mathrm{Re}}\) \( \newcommand{\ImaginaryPart}{\mathrm{Im}}\)
\( \newcommand{\Argument}{\mathrm{Arg}}\) \( \newcommand{\norm}[1]{\| #1 \|}\)
\( \newcommand{\inner}[2]{\langle #1, #2 \rangle}\)
\( \newcommand{\Span}{\mathrm{span}}\)
\( \newcommand{\id}{\mathrm{id}}\)
\( \newcommand{\Span}{\mathrm{span}}\)
\( \newcommand{\kernel}{\mathrm{null}\,}\)
\( \newcommand{\range}{\mathrm{range}\,}\)
\( \newcommand{\RealPart}{\mathrm{Re}}\)
\( \newcommand{\ImaginaryPart}{\mathrm{Im}}\)
\( \newcommand{\Argument}{\mathrm{Arg}}\)
\( \newcommand{\norm}[1]{\| #1 \|}\)
\( \newcommand{\inner}[2]{\langle #1, #2 \rangle}\)
\( \newcommand{\Span}{\mathrm{span}}\) \( \newcommand{\AA}{\unicode[.8,0]{x212B}}\)
\( \newcommand{\vectorA}[1]{\vec{#1}} % arrow\)
\( \newcommand{\vectorAt}[1]{\vec{\text{#1}}} % arrow\)
\( \newcommand{\vectorB}[1]{\overset { \scriptstyle \rightharpoonup} {\mathbf{#1}} } \)
\( \newcommand{\vectorC}[1]{\textbf{#1}} \)
\( \newcommand{\vectorD}[1]{\overrightarrow{#1}} \)
\( \newcommand{\vectorDt}[1]{\overrightarrow{\text{#1}}} \)
\( \newcommand{\vectE}[1]{\overset{-\!-\!\rightharpoonup}{\vphantom{a}\smash{\mathbf {#1}}}} \)
\( \newcommand{\vecs}[1]{\overset { \scriptstyle \rightharpoonup} {\mathbf{#1}} } \)
\(\newcommand{\longvect}{\overrightarrow}\)
\( \newcommand{\vecd}[1]{\overset{-\!-\!\rightharpoonup}{\vphantom{a}\smash {#1}}} \)
\(\newcommand{\avec}{\mathbf a}\) \(\newcommand{\bvec}{\mathbf b}\) \(\newcommand{\cvec}{\mathbf c}\) \(\newcommand{\dvec}{\mathbf d}\) \(\newcommand{\dtil}{\widetilde{\mathbf d}}\) \(\newcommand{\evec}{\mathbf e}\) \(\newcommand{\fvec}{\mathbf f}\) \(\newcommand{\nvec}{\mathbf n}\) \(\newcommand{\pvec}{\mathbf p}\) \(\newcommand{\qvec}{\mathbf q}\) \(\newcommand{\svec}{\mathbf s}\) \(\newcommand{\tvec}{\mathbf t}\) \(\newcommand{\uvec}{\mathbf u}\) \(\newcommand{\vvec}{\mathbf v}\) \(\newcommand{\wvec}{\mathbf w}\) \(\newcommand{\xvec}{\mathbf x}\) \(\newcommand{\yvec}{\mathbf y}\) \(\newcommand{\zvec}{\mathbf z}\) \(\newcommand{\rvec}{\mathbf r}\) \(\newcommand{\mvec}{\mathbf m}\) \(\newcommand{\zerovec}{\mathbf 0}\) \(\newcommand{\onevec}{\mathbf 1}\) \(\newcommand{\real}{\mathbb R}\) \(\newcommand{\twovec}[2]{\left[\begin{array}{r}#1 \\ #2 \end{array}\right]}\) \(\newcommand{\ctwovec}[2]{\left[\begin{array}{c}#1 \\ #2 \end{array}\right]}\) \(\newcommand{\threevec}[3]{\left[\begin{array}{r}#1 \\ #2 \\ #3 \end{array}\right]}\) \(\newcommand{\cthreevec}[3]{\left[\begin{array}{c}#1 \\ #2 \\ #3 \end{array}\right]}\) \(\newcommand{\fourvec}[4]{\left[\begin{array}{r}#1 \\ #2 \\ #3 \\ #4 \end{array}\right]}\) \(\newcommand{\cfourvec}[4]{\left[\begin{array}{c}#1 \\ #2 \\ #3 \\ #4 \end{array}\right]}\) \(\newcommand{\fivevec}[5]{\left[\begin{array}{r}#1 \\ #2 \\ #3 \\ #4 \\ #5 \\ \end{array}\right]}\) \(\newcommand{\cfivevec}[5]{\left[\begin{array}{c}#1 \\ #2 \\ #3 \\ #4 \\ #5 \\ \end{array}\right]}\) \(\newcommand{\mattwo}[4]{\left[\begin{array}{rr}#1 \amp #2 \\ #3 \amp #4 \\ \end{array}\right]}\) \(\newcommand{\laspan}[1]{\text{Span}\{#1\}}\) \(\newcommand{\bcal}{\cal B}\) \(\newcommand{\ccal}{\cal C}\) \(\newcommand{\scal}{\cal S}\) \(\newcommand{\wcal}{\cal W}\) \(\newcommand{\ecal}{\cal E}\) \(\newcommand{\coords}[2]{\left\{#1\right\}_{#2}}\) \(\newcommand{\gray}[1]{\color{gray}{#1}}\) \(\newcommand{\lgray}[1]{\color{lightgray}{#1}}\) \(\newcommand{\rank}{\operatorname{rank}}\) \(\newcommand{\row}{\text{Row}}\) \(\newcommand{\col}{\text{Col}}\) \(\renewcommand{\row}{\text{Row}}\) \(\newcommand{\nul}{\text{Nul}}\) \(\newcommand{\var}{\text{Var}}\) \(\newcommand{\corr}{\text{corr}}\) \(\newcommand{\len}[1]{\left|#1\right|}\) \(\newcommand{\bbar}{\overline{\bvec}}\) \(\newcommand{\bhat}{\widehat{\bvec}}\) \(\newcommand{\bperp}{\bvec^\perp}\) \(\newcommand{\xhat}{\widehat{\xvec}}\) \(\newcommand{\vhat}{\widehat{\vvec}}\) \(\newcommand{\uhat}{\widehat{\uvec}}\) \(\newcommand{\what}{\widehat{\wvec}}\) \(\newcommand{\Sighat}{\widehat{\Sigma}}\) \(\newcommand{\lt}{<}\) \(\newcommand{\gt}{>}\) \(\newcommand{\amp}{&}\) \(\definecolor{fillinmathshade}{gray}{0.9}\)How can we use stellar spectra to determine the properties of stars? What's the connection between spectral features and temperature, or chemical composition, or density? Let's start by putting different spectra into groups, so that we face only ten or twenty classes instead of thousands of individual stars.
The Harvard classification system
Thanks to a generous donation from the estate of Henry Draper, the Harvard College Observatory acquired the world's largest collection of stellar spectra in the late nineteenth and early twentieth century. Few male scientists would pore over the thousands of tiny spectra with microscopes on hundreds of glass plates; it was too boring and didn't pay enough. The job of recording, measuring, and classifying this wealth of information was given to a group of female scientists, led by Annie Jump Cannon and Williamina Fleming.
Fleming decided to use the absorption lines of hydrogen to place spectra into different classes. She called the spectra with the strongest lines "A", the next strongest "B", and worked her way down the alphabet to "O", where the lines were virtually invisible. Here's a small selection of spectra shown in that order:
A

A

B

B

F

G

K

K

M

M

O

Cannon noticed that this arrangement ALMOST put stars in order by temperature -- -- as measured by the continuum of the spectrum, and by photometric colors. With just a few changes (getting rid of some intermediate classes, and shifting the O class to the top of the list), Cannon created a true temperature sequence that has since been used as the primary means of classifying stars.
The result of decades of hard work by the Harvard astronomers was the Henry Draper Catalogue and Extension , which contains classifications for over 270,000 stars.
Each of the major classes
- O h,
- B e
- A
- F ine
- G irl
- K iss
- M e
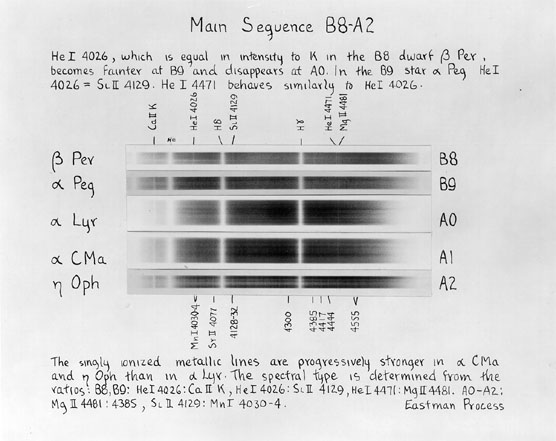
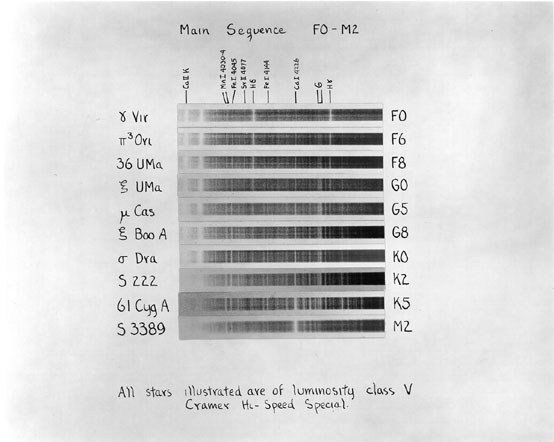
was broken up into ten subclasses. For example, "A0" stars are the hottest within the A class, followed by "A1". "A2", and down to "A9", which is followed in turn by "F0". To distinguish these sub-classes, the Harvard astronomers used the ratios of certain absorption lines, as these examples show:
Exercise \(\PageIndex{1}\)
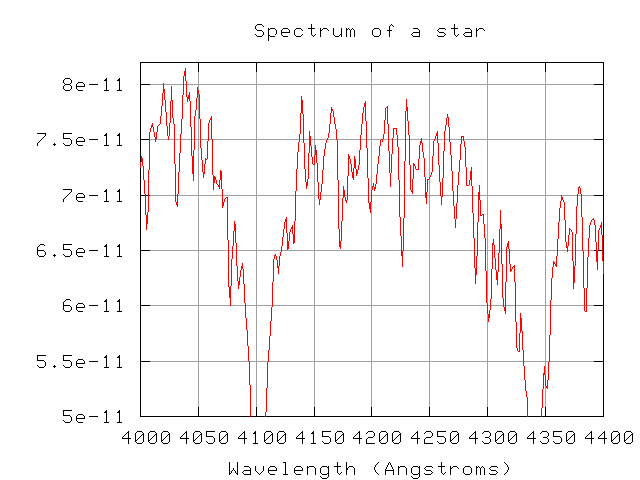
Classify the star below, using the rules shown in the charts above (and the rules in Table 8.1 of your textbook). First, a view of the entire spectrum in the blue:
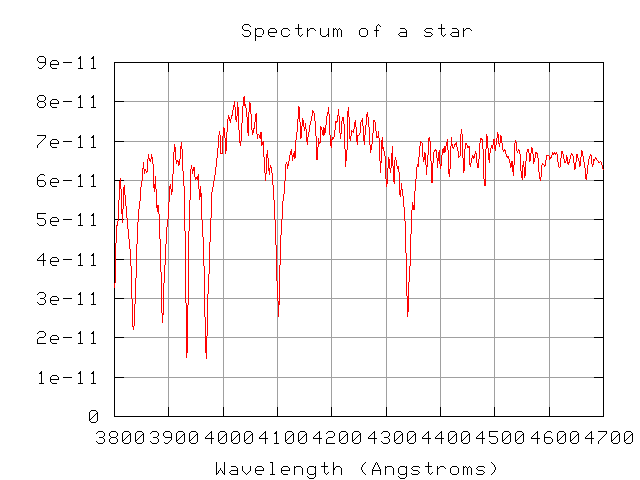
Now, a closeup of the region between 4000 and 4400 Angstroms.
Equivalent width
Okay, so we can place stellar spectra into classes, which have something to do with the temperature of their outer layers. Fine. But what about the abundances of different chemical elements? How is chemical composition related to the strength of absorption lines?
For example,
- if we see a line of hydrogen, does that mean that the star contains hydrogen?
- if we DON'T see a line of hydrogen, does that mean that the star DOESN'T contain hydrogen?
- if we do see an absorption line of hydrogen, how much hydrogen must there be in the photosphere?
- if a line due to hydrogen is stronger than one due to iron, does that mean there are more H than Fe atoms in the photosphere?
Good questions. In order to address them, we need a quantitative measure of the "strength" of an absorption line. Astronomers have chosen a quantity called equivalent width to describe absorption lines. If we plot intensity versus wavelength in the standard manner,
then we can measure the "strength" of a line by measuring the "area under the curve". The top of the area is supposed to be the level of the surrounding continuum, but it can be hard to find the continuum in some cases. This one isn't so bad....
Now, the equivalent width of a line is simply the width of a perfectly rectangular line of the SAME AREA which would run from the continuum all the way down to zero (that is, no light at all). This line has an equivalent width of about 10 Angstroms, it would seem.
Exercise \(\PageIndex{2}\)
- What is the equivalent width of the line near 4225 Angstroms?
- What element produces this line?
Using spectra to determine composition: Round One
Right. The Henry Draper project provided an enormous number of stellar spectra and a rough classification for each. As telescopes grew larger and larger, astronomers could take more and more detailed spectra, with higher and higher signal to noise. It was soon possible to measure very precisely the strengths of many different lines in a number of stars. The question was -- how were the lines connected to abundances?
Consider the following two small sections of spectra: one from the star Vega, one from the star 104 Tau (the spectrum of which is very similar to that of the Sun).
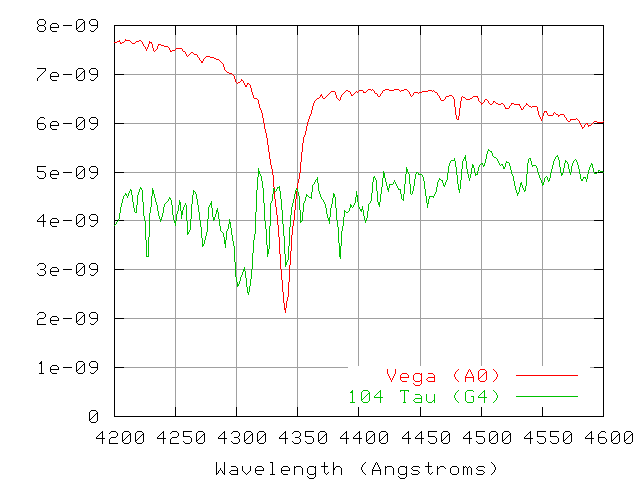
- A view of the spectra between 4000 and 4150 Angstroms
- A view of the spectra between 4400 and 4550 Angstroms
Exercise \(\PageIndex{3}\)
- Measure the equivalent widths for the (3 to 5) strongest lines in the spectrum of each star.
- Identify the element responsible for each of these strong lines.
- Using equivalent width as a proxy for abundance, calculate the relative abundances for the most common elements in each star.
For more information
- An Atlas of Stellar Spectra describes a later extension of the Harvard system. It provides details on how one should examine low-dispersion stellar spectra to classify them.
- STELIB provides examples of stellar spectra in digital form.
- Spectral templates for stars and other sources from the SDSS.
- The CLEA project provides software which gives you practice in classifying spectra, plus a tool you can use on real spectra in the future.