
5.1: Blackbody Radiation
- Page ID
- 81935

What is a "Blackbody"?
In Physics 9B we briefly discussed the idea of a blackbody when we discussed heat transfer by radiation. Now that you have taken Physics 9C, you can understand a little more detail about this concept, and see why it was causing physicists fits right at the turn of the century.
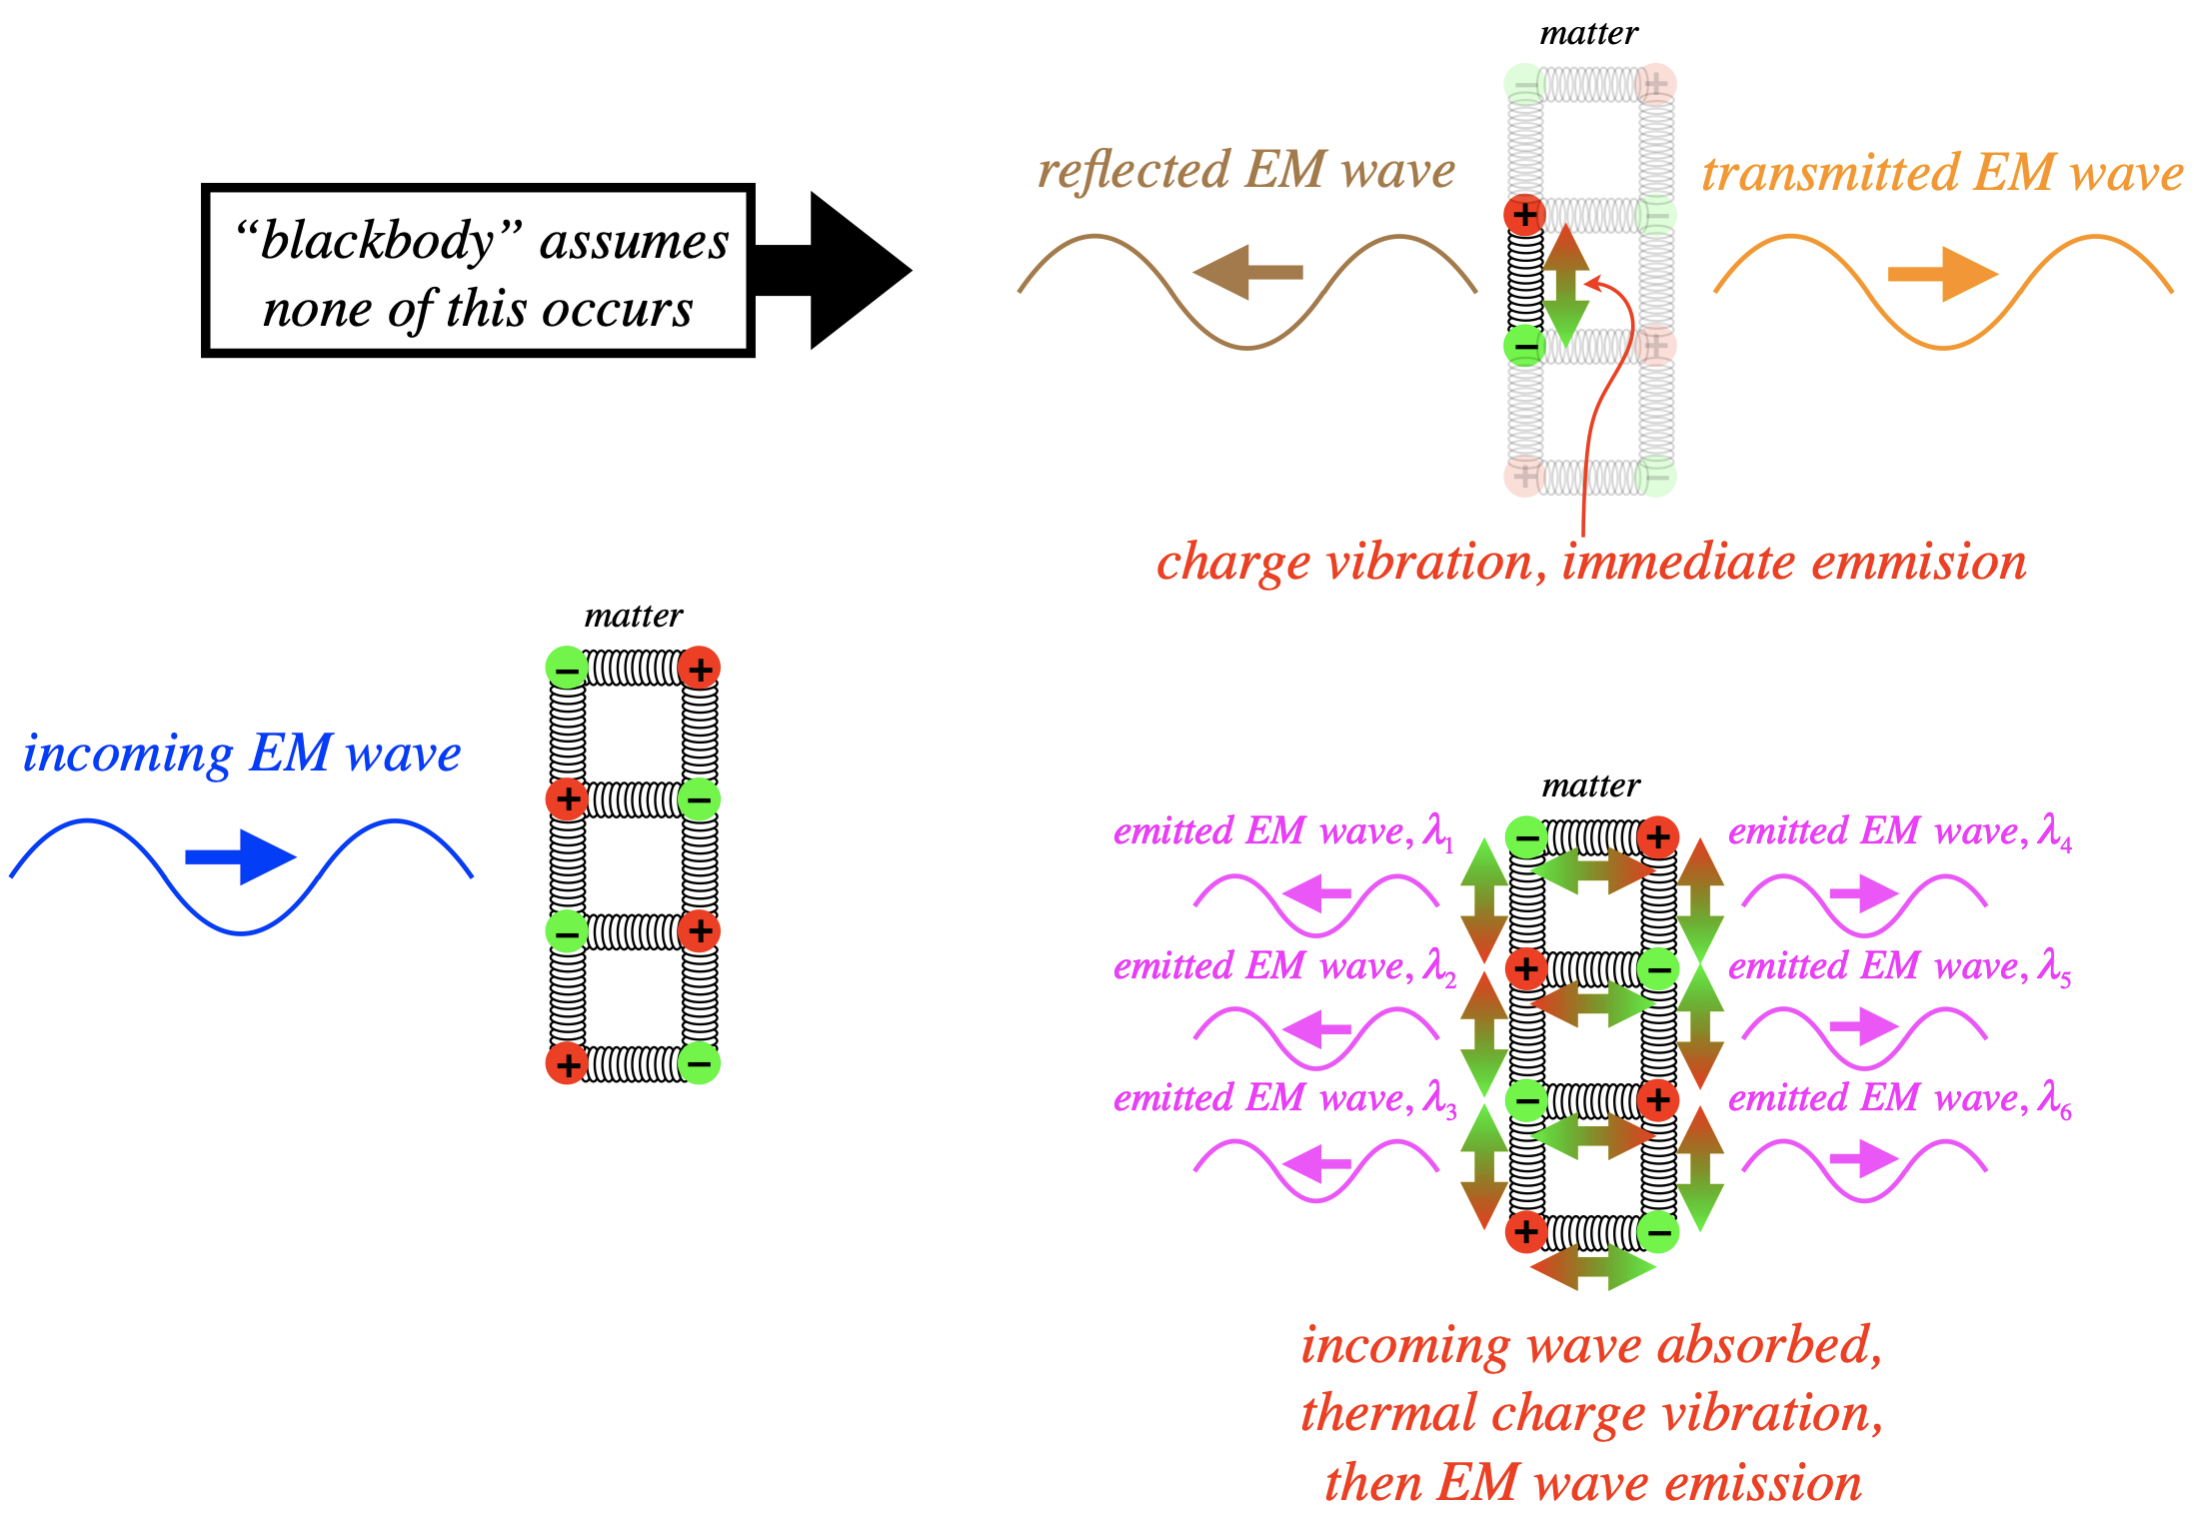
We know that EM radiation consists of fluctuating electric and magnetic fields. These fluctuations need to be at least of second-order (since the derivatives in the wave equation are second order), which means that they can only be created by accelerating electric charges. We often model electric charges in matter as being held in a lattice with spring-like bonds. So if those charges are oscillating in those bonds, they can give off light. There are essentially two ways that a piece of matter does this. One is for EM radiation to strike the matter and the fluctuating fields of the radiation cause the charges to vibrate, which in turn gives off more radiation. Another is to simply heat the matter, which we know causes the particles comprising it to vibrate. The former version is essentially just transmission or reflection. In the case of a blackbody, we ignore this transmission/reflection mode. Instead, we assume that all of the incoming EM radiation is totally absorbed by the matter, which then redistributes the energy throughout its mass in the form of thermal energy, and then the only EM radiation it emits is due to thermal vibrations of the charges.
Figure 5.1.1 – Blackbodies "Thermalize" Radiation
One might ask where the name "blackbody" comes from. Imagine some yellow light striking such an object. If it is totally reflected, then yellow light is emitted by it. But if the light's energy is absorbed by the object, and that energy is distributed randomly through the atoms which then emit light in a wide spectrum of frequencies, then the light that comes out will not all be in the visible spectrum, and if the amount in the visible specturm is small, then the object's appearance is black.
Of course, an object's ability to turn incoming light into randomly-partitioned energy amongst its atoms depends upon a number of factors. In Physics 9B, we lumped all those factors into a single factor we called the emissivity. Mostly this quantity depends upon the surface properties of the object, as this is where reflection occurs, and reflection needs to be avoided for the incoming light's energy to be absorbed and distributed within the object. As we stated in Physics 9B, a blackbody is an object with emissivity of 1, which means that every joule of radiation that strikes the object is converted into thermal energy (none is reflected). The subsequently emitted radiation comes out in a spectrum distributed in a specific way that depends upon the body's temperature.
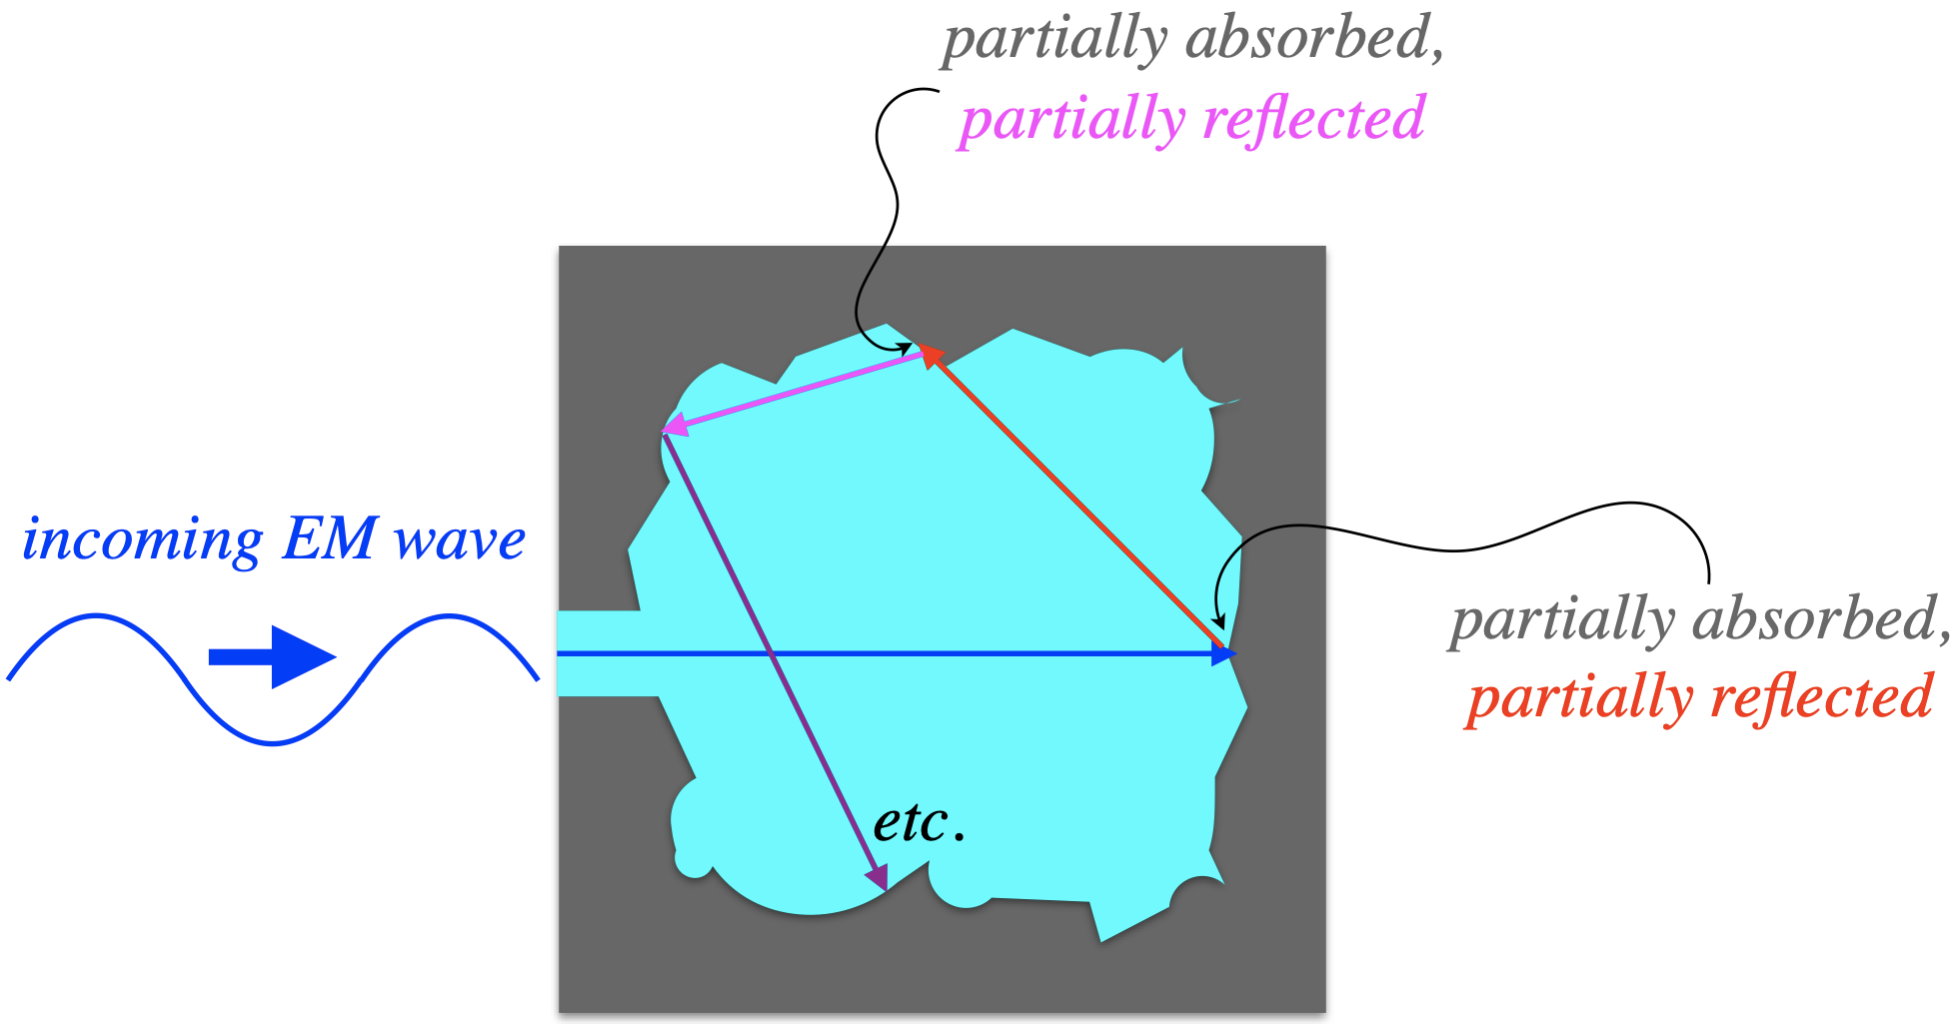
Physicists in the 19th century devised a clever way to construct an object that imitates very closely the properties of a blackbody. They cut out a cavity from a block of material and left a small hole as an entrance, so that any radiation that enters that hole would be partially absorbed (turned into thermal energy), and partially reflected, but the reflected part is not likely to return out the hole. Instead, it will strike another interior wall of the cavity, again being partially absorbed. By the time the radiation has reflected enough times to accidentally return out the hole, pretty much all of its energy has been converted to thermal. Therefore, for the region where the hole exists, the cavity behaves exactly like a blackbody – all of the incoming radiation is converted to thermal energy, and the only energy that comes out of that hole is due to thermal motions of the charged particles in the material.
Figure 5.1.2 – Radiative Cavity as a Blackbody
In the late 1800’s, experiments were performed with these makeshift blackbodies. Note that since the charged particles are moving thermally, their motions can have any of a wide range of frequencies (and therefore so can the EM waves they emit). Physicists were interested in explaining how the outgoing energy was distributed among the emerging EM waves of various wavelengths, and how this distribution depended upon the temperature of the material. The theory that attempts to explain this frequency distribution is steeped in statistical physics (a field of physics that handles issues like the randomness exhibited by the vibrational frequencies of thermally-excited electrons in our blackbody material) that we will not cover in detail in this course. We'll say something about the shape of this distribution shortly, but it should first be noted that the range of frequencies that represent the biggest share of the energy emitted depends upon the temperature of the blackbody. The lower its temperature, the lower the range of peak frequencies lies.
We are already somewhat familiar with this fact. We know that when we heat a piece of metal, we can first start to feel heat radiating from it (infrared radiation – lower frequency than visible light), then when it gets hotter it starts to “glow” red, then hotter still, red starts to be accompanied by other, shorter wavelengths, making it “white hot,” and so on.
Figure 5.1.3 – Glowing Hot Metal

So we would (correctly) guess that the most populated wavelength emitted by a blackbody gets shorter as the temperature rises. If we were to plot the distribution of energy as a function of wavelength, we would expect it to peak at the wavelength ordained by the temperature to be the most common, and re-plotting this graph for a new temperature would shift the peak. The figure below shows several plots of intensity (brightness) of light emitted by a blackbody, as a function of wavelength. Each plot represents the distribution for a blackbody of a different temperature. The range of wavelengths on the horizontal axis that corresponds to the visible spectrum is shown.
Figure 5.1.4 – Blackbody Radiation Curve
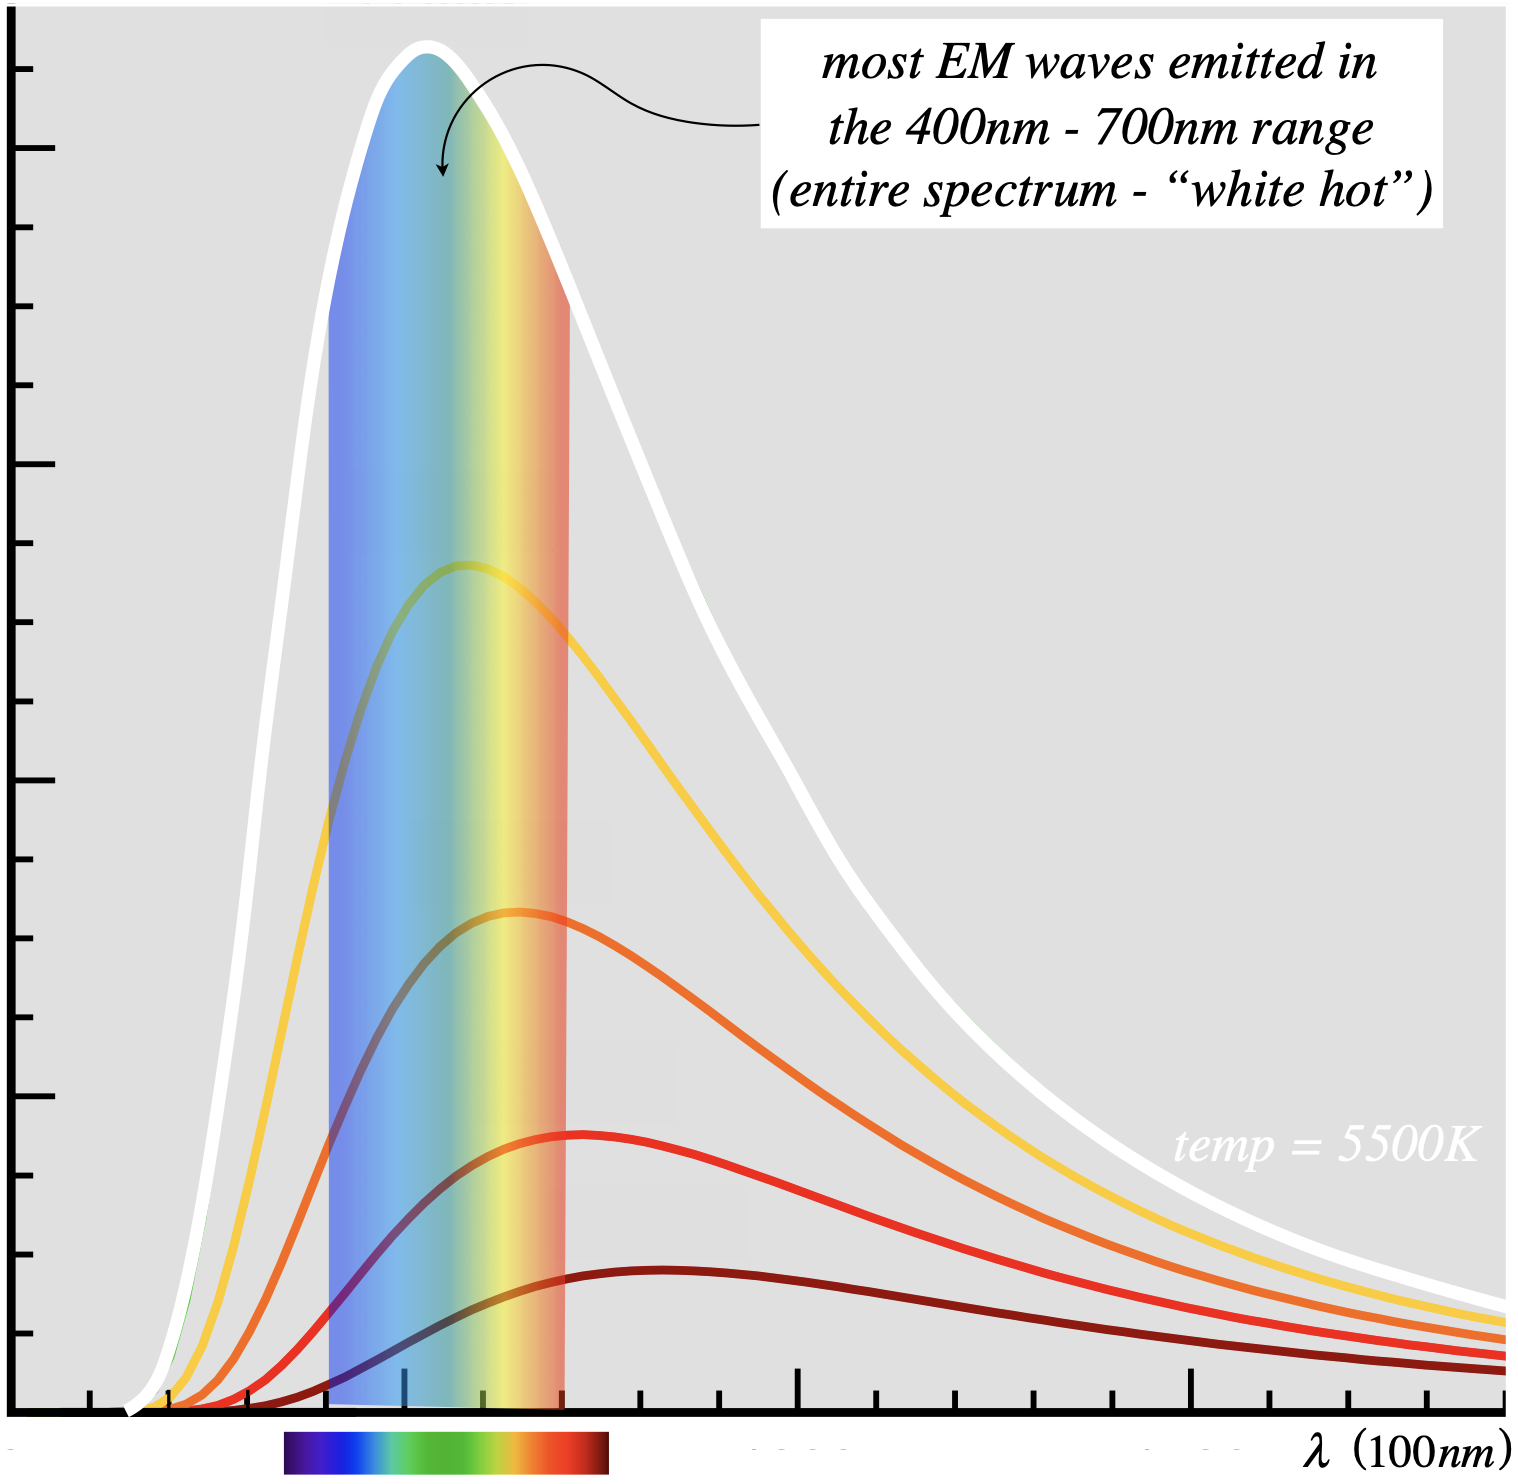
The lowest curve on in this figure corresponds to the lowest temperature of the group, and the highest (white) curve corresponds to the hottest (\(5500K\)). The temperature for the white curve is the surface temperature of the Sun, and as you can see, this corresponds to peaks emission in the visible spectrum. This is no coincidence, as what is "visible" is defined by what creatures on Earth are able to perceive with their senses, and these senses evolved in the presence of this very light.
Let's say a few words about the mathematical meaning of the curves shown in the graph above. Above we stated that this was a plot of intensity vs. frequency, but that is not quite right. One cannot attribute a brightness to a single, precise wavelength, as the total light energy is finite and it is distributed throughout an infinite number of wavelengths. Each wavelength is therefore responsible for an infinitesimal amount of energy, and therefore has zero intensity. What this curve instead shows is a spectral density of light intensity. "Spectral" loosely means "as a function of wavelength" (or equivalently, frequency). With any density, we integrate it over some range to get a total quantity. For example, to get total electric charge in a line segment of charge, we integrate the linear charge density over the range of that segment:
\[Q\left(\text{in segment between }x=a\text{ and }x=b\right)=\int\limits_a^b\lambda\left(x\right)dx\]
Well, the curves above are plots of spectral density \(\Psi\), which means that the "\(a\) to \(b\)" range is between wavelengths, and the stuff that is added together is light intensity. So let's suppose that we measure the brightness of light coming from a blackbody of a given temperature (which defines one of those curves). Suppose further that we filter the contributions to this brightness, so that we only include light possessing wavelengths in the range \(\lambda_a\) to \(\lambda_b\). This total brightness is the area under the curve above, integrated from \(\lambda_a\) to \(\lambda_b\):
\[I_{ab} = \int\limits_{\lambda_a}^{\lambda_b}\Psi\left(\lambda,T\right)d\lambda\]
Back in Physics 9B, we saw that intensity for 3-dimensional waves is power (watts) per area (square meter). This quantity \(\Psi\) is the density of this quantity within a wavelength range. The spectral density is a function of both wavelength (the horizontal axis) and the temperature (the five curves shown in the diagram are all different temperatures.
Wien, Rayleigh-Jeans, and the "Ultraviolet Catastrophe"
A fellow named Wilhelm Wien used principles of thermodynamics to show that the relationship between the wavelength with the maximum contribution to the energy output and the temperature is in fact inverse. That is:
\[\lambda\left(\text{maximum emission}\right)\propto\frac{1}{T}\]
As you can see in the series of diagrams for various temperatures, as the temperature goes up, the wavelength at which the peak occurs goes down. Wien goes further, and approximates this curve with a pure guess regarding the function that defines it. He does so with a couple of adjustable constants that can be determined from experiments, but his function breaks down a bit at long wavelengths.
Perhaps a few words here are appropriate regarding techniques of scientific exploration. What Wien did in creating his radiation curve is essentially to reverse-engineer a branch of physics known as “phenomenology.” In physics, phenomenology is the field where the theory is bridged to experiment – coming up with ways to test theories in a lab. The reverse-engineering aspect of this discipline consists of admitting for the moment that we don’t understand the exact mechanism involved in an observation (i.e. we don’t have a theory, either because we are missing a piece to the puzzle, or the problem is too complicated to create an adequate model), but we can still create a mathematical model that reasonably predicts what we experimentally observe. It is clearly not an “answer,” and is obviously far less satisfying than a theory from first principles, but it can lead to progress nonetheless.
A couple of British physicists named Rayleigh and Jeans set out to derive this radiation curve from first principles. There are two key elements to this calculation. The first is that the energy of any given EM wave depends only upon the amplitude, not the frequency. That is, waves of blue light carry the same energy as waves of red light if their amplitudes are the same – a standard principle from wave mechanics that we learned in Physics 9B. And second, we need a good model for determining the expected populations of waves of various wavelengths, given a certain temperature. It turns out that the (at the time) recently-developed field of thermodynamics had an answer to this second element using something called the Boltzmann distribution and equipartition of energy. But when Rayleigh and Jeans applied this using a standing wave model within the blackbody cavity, they found that the fraction of the total energy that goes to the shorter wavelengths does not rapidly taper-down as the experiments indicated (i.e. as shown in the graphs we have seen), but rather continues to grow! The lack of agreement between the calculation of Rayleigh and Jeans and the sharp drop of the blackbody radiation curve (which occurs at wavelengths just shorter than visible violet light) became known as the “ultraviolet catastrophe.”
Planck’s Solution
A German physicist named Max Planck spent several years at the end of the 19th century working on the problem of the blackbody radiation curve. He first found that he could get the right formula by making a small tweak to Wien’s “pure guess” function, and then tried to reverse-engineer it back to the first principles of Rayleigh and Jeans. He found he couldn’t do that, so there had to be something wrong with the fundamentals behind the Rayleigh-Jeans solution.
He finally hit upon a solution right at the century’s turn, but it involved changing what seemed to be an immutable assumption. Rather than assume that the energy density of an EM wave is independent of its frequency, he found that assuming that EM waves occur in individual packets of energy proportional to their frequencies gave the correct blackbody radiation law. In particular, he found that if he assumed that if an individual EM wave of frequency \(f\) carried an energy of \(hf\) (where is \(h\) a constant, and of course \(\lambda f = c\)), then using Boltzmann’s statistics, the equation of the spectral energy density curve would come out to what he had already determined must be correct:
\[\Psi\left(\lambda\right)=\left(\dfrac{8\pi hc}{\lambda^5}\right)\dfrac{1}{e^{\frac{hc}{\lambda k_BT}}-1}\]
It's worth emphasizing how radical this was: Planck knew that the curve expressed by the function above matched the experimental data, and he was able to derive it from physical principles, but the idea that the energy of an EM wave could be proportional to the frequency was so far outside the understanding of the time that Planck was certain there was a problem somewhere that would eventually be worked-out. He published the result nonetheless.
It should be clear intuitively why this assumption would help avert the ultraviolet catastrophe. With the Rayleigh-Jeans assumption, there was no “energy penalty” for producing EM waves in higher and higher frequencies (shorter and shorter wavelengths), and since Boltzmann statistics allowed for more EM waves of higher frequencies than of lower frequencies, the equipartition theorem assured that a disproportionate amount of energy would go to those high frequency waves. But with the assumption of Planck, the higher the frequency we choose, the greater slice out of the total energy pie must be taken, leaving less remaining pie for other high frequency waves. This changes the statistics, weighting them against the higher frequencies, and causing the max value to hit a peak. Put another way, eventually the frequency will be so large (wavelength so small), that there simply isn’t enough energy in the whole blackbody to equal \(hf\), so that wave will never be created. The constant \(h\) is now referred to as Planck’s constant, and has the value:
\[h=6.63\times 10^{-34}J\cdot s \nonumber\]
The idea that light energy is proportional to frequency obviously begged to be explained, but this would have to wait for awhile. In the meantime, there was other evidence emerging that it is true. We will look at a couple more of these clues.