
2.6: Lines Spectra- Emission and Absorption Lines


( \newcommand{\kernel}{\mathrm{null}\,}\)
- You will be able to distinguish between emission and absorption lines in a spectrum
- You will know how spectral lines are produced
- You will be able to calculate the energy/frequency/wavelength of a photon absorbed or emitted by a hydrogen atom
Some students are completing an activity on absorption and emission spectra and discussing their answers.
- Isóbel: “I’m having a hard time remembering which type of lines are created by which process. Emission lines come from gas clouds, right?”
- José: “I don’t think so, don’t they come from hot sources? Gas clouds are cold.”
- Kensi: “Emission lines are created in hot sources, like a fluorescent lamp. Absorption lines are made when light passes through a colder source like gas clouds, and the gas absorbs particular wavelengths of light.”
Do you agree with any of these students, and if so, whom?
Isóbel
José
Kensi
None
Explain
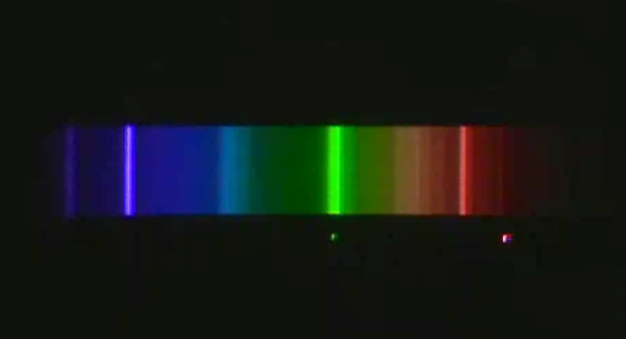
We now turn to non-continuous, or discrete, spectra. In discrete spectra, only a few frequencies are observed. We will learn about two kinds of discrete spectra: emission and absorption spectra. Figure 2.5 shows spectra from some everyday sources of light.
a.
b.
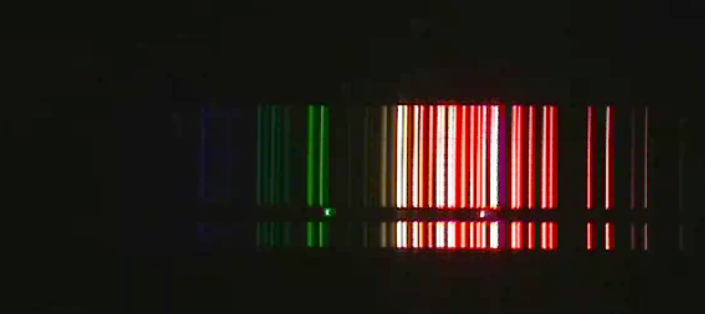

If you view a fluorescent lamp with a diffraction grating (which spreads light out into its various wavelengths similar to the way a prism does), you will see that it is emitting a rainbow, just like an incandescent lamp. However, if you look carefully, you will notice that certain colors are especially bright. The rainbow is produced by a coating on the inside of the bulb. The coating converts some of the light from the gas into a continuous spectrum. But the coating does not convert all of the light. The extra bright parts of the spectrum are the places where the discrete spectrum from the gas really stands out. Sometimes, you can see the pure discrete or emission-line spectrum coming from a gas tube that has no coating. A “neon” sign can be a good way to achieve this result. Incidentally, not all neon signs contain the element neon. We will discuss that later. In contrast to a fluorescent bulb or a gas tube, an incandescent lamp emits a purely continuous Planck spectrum.
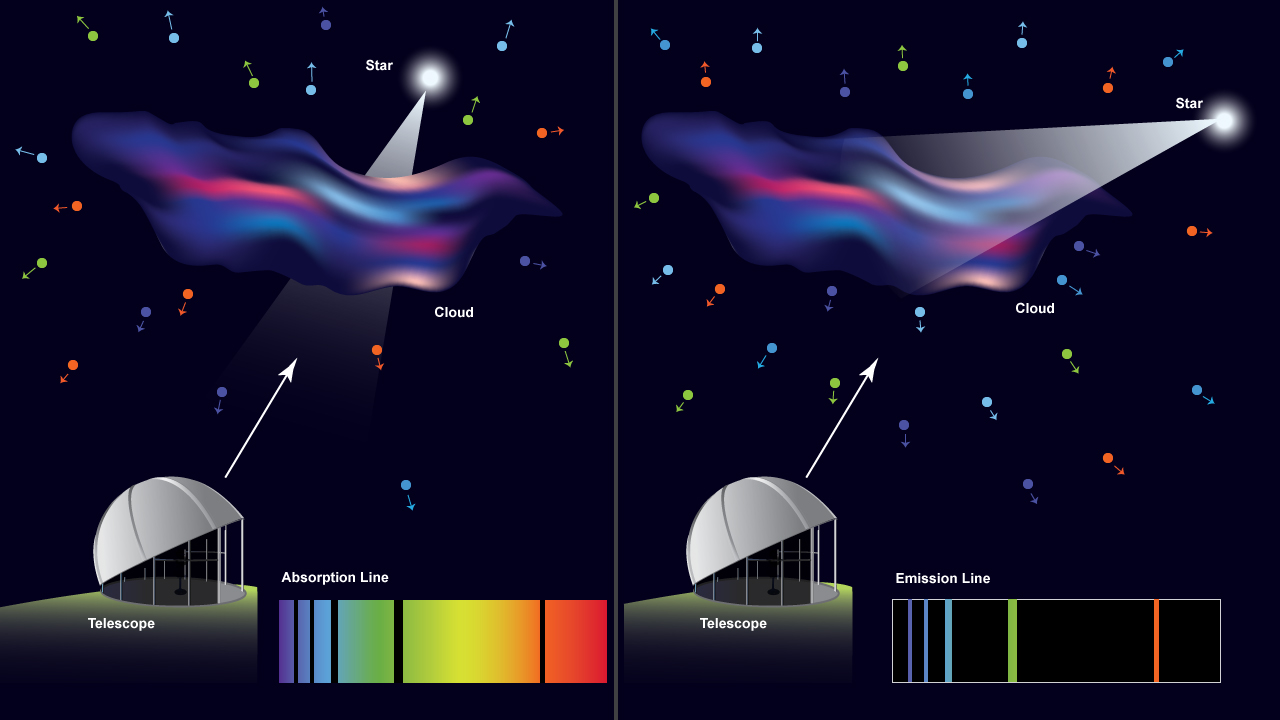
As shown in Figure 2.6, an absorption spectrum is created when a continuous source is viewed (head on) through a low-density cloud, and an emission spectrum is created when a source of energy is exciting a low-density cloud. This energy source could be, for example, a strong electric current (in the case of neon lights) or a nearby star (in the case of emission nebulae).
We now explore what happens when a cloud of thin gas is viewed at different angles in relationship to a source of continuous radiation. In the next activity, you will use the Spectrum Explorer simulation tool to explore how the spectrum you measure depends on the orientation of the light source. This activity will give you some experience with different emission and absorption spectra. After completing this activity you will know how astronomers are able to determine the composition of distant objects.
When we view a cloud of gas, the spectrum we see will depends on how we view it with respect to nearby light sources that illuminate it. In this activity, you will:
- Note your predictions.
- Make observations and record what you observe.
- Explain your predictions and your observations, noting any discrepancies.
Do not worry if you are not able to explain everything you see here yet; you will be revisiting the Spectrum Explorer several times.
Imagine there is a container, perhaps a glass tube, that can be empty or filled with hydrogen gas. There are also two light sources that can be turned on and off in such a way that they illuminate the tube. Additionally, we have a spectroscope with which to collect light and separate it to produce a spectrum. The resulting spectrum is displayed at the bottom of the screen. In an astronomical setting, a similar situation would occur if we viewed a star behind a gas cloud or if we viewed a gas cloud that had a star nearby but off to one side.
A. Nothing between observer and light sources.
1. Predictions: At first, both light sources are off and the glass tube has no gas in it. The clear spectroscope is thus dark. If you then turn on light source B, what do you expect to see in the scope? Choose one of the following:
A series of bright lines
A series of bright lines on top of a continuous rainbow
A series of dark lines in an otherwise continuous rainbow
A continuous rainbow with no lines
Nothing will change. We will still see darkness.
2. Observations: Keeping the gas tube clear turn on light source B. What spectrum do you observe?
A series of bright lines
A series of bright lines on top of a continuous rainbow
A series of dark lines in an otherwise continuous rainbow
A continuous rainbow with no lines
Nothing will change. We will still see darkness.
3. Is this result consistent with what you predicted in Question 1? Resolve any discrepancies.
B. Tube filled with hydrogen. Head on.
1. Predictions: What do you expect to see with light source B on and hydrogen filling the tube?
A series of bright lines
A series of bright lines on top of a continuous rainbow
A series of dark lines in an otherwise continuous rainbow
A continuous rainbow with no lines
Nothing will change. We will still see darkness.
2. Observations: Select hydrogen to fill the tube by dragging down the menu on the glass tube icon and selecting hydrogen. What do you see in the spectroscope display?
A series of bright lines
A series of bright lines on top of a continuous rainbow
A series of dark lines in an otherwise continuous rainbow
A continuous rainbow with no lines
Nothing will change. We will still see darkness.
3. Is this the result you predicted you would see? This series of lines is called an absorption spectrum. Resolve any discrepancies between your predictions and observations.
4. Describe the differences in the spectrum when the hydrogen is present and when it is absent. What do you think is occurring in the hydrogen to cause the different appearance? (Hint: why do you think we call this type of spectrum an absorption spectrum?)
5. If we had used a gas other than hydrogen, how might things have been the same and how might they have been different? Recall that other atoms have more electrons than hydrogen. We will have a chance to work with other types of gasses in a later activity, so if you are not sure about the answer here, don’t worry. We will explore these ideas in more detail later in the chapter.
C. No gas in the tube, light source side on.
Now turn off light source B and empty the tube of gas. You should see only darkness in the spectroscope.
1. Predictions: If you turn on light source A, what do you think the spectroscope will show?
A series of bright lines
A series of bright lines on top of a continuous rainbow
A series of dark lines in an otherwise continuous rainbow
A continuous rainbow with no lines
Nothing will change. We willl still see darkness.
2. Observations: Now turn on light source A. What does the spectroscope show?
A series of bright lines
A series of bright lines on top of a continuous rainbow
A series of bright lines in an otherwise continuous rainbow
A continuous rainbow with no lines
Nothing will change. We will still see darkness.
3. Is this the result you expected to see? Resolve any discrepancies.
D. Gas in the tube, light source side on.
1. Predictions: What do you think you will see if we fill the tube with hydrogen gas?
A series of bright lines
A series of bright lines on top of a continuous rainbow
A series of dark lines in an otherwise continuous rainbow
A continuous rainbow with no lines
Nothing will change. We will still see darkness.
2. Observations: Select hydrogen from the drop-down menu to fill the tube with gas. Now turn on light source A. What does the spectroscope show?
A series of bright lines
A series of bright lines on top of a continuous rainbow
A series of dark lines in an otherwise continuous rainbow
A continuous rainbow with no lines
Nothing will change. We will still see darkness.
3. Is the result you expected it would be? This type of spectrum is called an emission spectrum. Record what you think is happening in the hydrogen to produce the spectrum you observe. Again, don’t worry too much about getting the right answer here. We will have additional opportunities to learn about how atoms absorb and emit light.
4. Leaving the hydrogen in the tube, alternately switch on light source A and then B. You can only have one light source on at a time, so switching A on will turn B off, and vice versa. Record what you see happening. If you have an idea of what is occurring in the gas to produce the spectra you see, write that explanation down here.
In this activity, we have imagined a laboratory with gas contained in a glass tube and light sources that we could control with a switch. In an astrophysical context, we cannot control the light sources or the gas in the “tube.” For astronomical sources, the glass tube might be replaced by a cloud of gas in space. The light source would be nearby stars, either behind or adjacent to the gas clouds. Alternatively, the glass tube could be the cooler top layers of a star’s atmosphere. In that case the light source would be the hotter, inner parts of a star’s atmosphere. These sorts of observations of spectra from astrophysical sources led to a revolutionary change in our understanding of matter and energy at the beginning of the 20th century.
Now that you have observed how various types of spectra are produced in a general sense, let us explain your observations in detail.
Line spectra were first observed and studied in the latter half of the 19th century, but it was only in the 1920s that a full explanation was finally developed. To explain the energy emitted by atoms, a new branch of physics was developed, called quantum mechanics. In quantum mechanics, not only does light come in discrete little packets called photons, but the energies and other properties of electrons in atoms are also discrete, or quantized. So, for example, in an atom of hydrogen, the electron orbiting the nucleus can only have certain discrete energies. Other energies are simply not allowed. This may sound strange, but that is that is observed. We can use the results from quantum mechanics to consider what this theory implies for the spectrum emitted by an atom.
a.
b.

We will use hydrogen as a first example. Because it has only a single electron, its spectrum is much simpler to analyze and understand.
Generally, the electron in a hydrogen atom sits at its lowest-possible allowed energy state, called the ground state. We can illustrate why this is so using an example from the macroscopic world around us. Even there, objects tend to be in their lowest possible energy. So, for instance, a cup of coffee might rest on a table, but if the table is removed, the coffee will fall to the floor. If the table happens to be on the second floor of a building, perhaps hanging over the edge of a balcony looking down to the first floor, then the coffee could fall all the way down to the first floor (Figure 2.8). Each of these motions would correspond to an energy transition. The coffee would move from a high-energy state to a low-energy state. Coffee (or anything else) will always move to a lower-energy state unless something prevents it from doing so (like the imposition of a table or the grasp of your hand).

Figure 2.8: When an object falls in a gravitational field, it loses gravitational potential energy (energy it had by virtue of its height). Since energy is conserved, this energy must go someplace. In a falling object, it goes into the energy of the object’s motion. The energy can be further transformed, perhaps by shattering the chemical bonds in the coffee cup depicted here when it impacts the ground. The coffee cup is moving from a state of high potential energy to a state with low potential energy. Credit: NASA/SSU/Aurore Simonnet.
Atoms are similar to coffee cups in that electrons will always fall to their lowest-allowed energy state within the atom. However, unlike a cup of coffee, which could in principle fall all the way to the center of Earth (where the gravitational field is zero) if it were unobstructed, there is a lowest-possible energy state below which the electron cannot fall. This state is called the ground state.
When an electron is in the ground state of hydrogen, its average position is slightly separated from the proton, though its precise position at any given moment is not well-defined. Even though the electron does not have a well-defined position in space, the ground state, as with any other energy state, has a very well-defined energy: it is 13.6 eV below the free electron states for a hydrogen atom. That is, an energy of 13.6 eV is required to completely free the electron from the proton, thus ionizing the hydrogen.
There are additional allowed energy states within a hydrogen atom that are above the ground state but still below the energy required to free the electron. For instance, the next possible energy above the ground state sits 3.4 eV below the free states. All of the additional allowed states have higher energies still. Collectively, these allowed states above the ground state are called excited states, and several of them are depicted in Figure 2.7-c. This terminology derives from the fact that the electron must gain energy, or be "excited," in order to move into one of them from the ground state. Typically, none of the excited states are occupied; any electron in one of the excited states will spontaneously fall to an unoccupied lower energy state after a very brief time. Hydrogen has only one electron, so if that electron is in a highly excited state, it will quickly fall down to the unoccupied ground state.
The energy levels of hydrogen can be calculated by the following expression.
En=−13.61n2eV
The index parameter n is used to label the level of interest: n = 1 is the ground state, n = 2 is the first excited state, n = 3 the second excited state, and so on. The energies are given in electron volts (eV). They are negative because they sit below the lowest free-state energy, which is defined to be zero.
You might be wondering where the difference in energy goes when an electron falls from some excited state to the ground state. Energy must always be conserved, which means it can be transferred or transformed, but never created or destroyed. So if the electron has lost energy, it must have put that energy somewhere; that somewhere is into a photon. When an electron drops from a higher-energy state to a lower one, it emits a photon with an energy (hf) that is exactly the energy difference (ΔE) between the higher- and lower-energy states:
Ephoton=hf=ΔEelectron
So, for example, if an electron in the first excited state drops to the ground state, it will emit light of energy given by the difference in energy of the two states. A similar thing happens if you drop a coffee cup off the kitchen table: The cup accelerates toward the floor, moving faster and faster because as it falls, it converts gravitational energy into the energy of motion. The electron in an atom does not convert the difference in energy into accelerated motion when it undergoes an energy transition. Instead, the energy difference between each state is converted into a photon with energy equal to that difference. This process explains how line spectra are produced.
Of course, for light to be emitted, an atom must contain an excited electron in the first place. This can be done, for instance, if the atoms undergo collisions. When the collisions are violent enough, some of that energy can be converted into excitation energy in each of them. The excited atoms will then spontaneously de-excite, emitting light in the process. This process is exactly how fluorescent and neon lights work. They contain a mixture of gases (typically not hydrogen), and when we apply an electric field to the gas, collisions occur within it. The result of the collisions is excitation of electrons. These excited electrons spontaneously de-excite, producing light as they do so.
Collisions are not the only way to excite an atom. If light with the exact energy difference between two energy levels shines on an atom, then the atom can absorb some of that light. An electron gets excited from the lower-energy level to the higher level in the process. For this process to occur there must be an electron in the lower-energy level to start with. There must also be space in the higher level for the electron to move into.
The gaps (dark lines) in an absorption spectrum are formed because light of the specific energy (or wavelength, if you prefer) in the dark lines is absorbed by the atoms in a gas. This process is called photo-excitation. The photo-excited atoms will quickly de-excite (the electron will fall back to its original energy level) and re-emit the absorbed photon. However, the emitted photon will be emitted in a random direction. Only occasionally will the light be emitted in the direction of the original photon. As a result, you will see a dimmer area in the narrow wavelength region where the photon energy corresponds to the atomic energy transition. On either side of that dark line, the spectrum will be unaffected, showing its normal brightness. Stars typically show absorption spectra because the cooler gas layers near their surface absorb some of the light emitted by the hotter layers below.
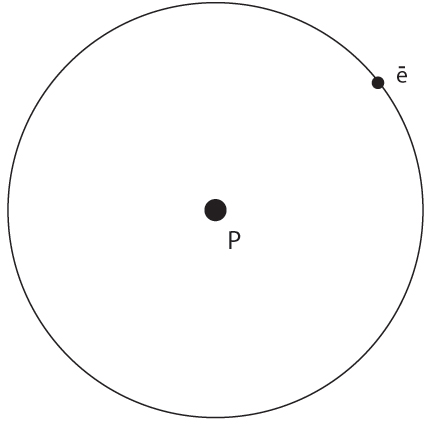
The figure in the exercise panel depicts a cartoon hydrogen atom. In the center is an electron in one of its possible orbital states. Next to it on the right is a diagram of the energy level that the electron occupies.
Your job is to identify whether the atom makes a transition that involves the emission or absorption of a photon.
Press the “next transitions” button to cause the hydrogen atom to undergo a transition to a higher - or maybe lower - energy state. Use the “absorption” and “emission” buttons to indicate what kind of a transition you just witnessed.
Repeat this process until you feel confident in your answers.
1. Describe what happens to the electron’s energy levels for:
a. an absorption
b. an emission
2. How do the changes in the drawing of the atom (in the center) correspond to the changes in the energy levels shown (on right)?
In the following activity, you will calculate the energies of photons that are emitted in various transitions for electrons in a hydrogen atom.
Worked Example:
Calculate the (a) energy, (b) frequency, and (c) wavelength of the photon emitted when a hydrogen atom’s electron in the first excited state drops to the ground state. (d) What waveband of the electromagnetic spectrum
is this?
A. Energy
- Find: Ephoton (energy of the photon)
- Given:
n=2 = first excited state
n=1 = ground state
E1 = energy of the ground state = -13.6 eV - Concept(s):
En=(−13.6eV)(1/n2) - Ephoton=ΔE=E2−E1 (energy of the photon equals change in energy of electron)
- Solution:
E2 = energy of first excited state
E2=(−13.6eV)(1/22)=(−13.6eV)(1/4)=−3.4eV
Ephoton=(−3.4eV)−(−13.6eV)=10.2eV
B. Frequency:
- Find: f
- Given: E = 10.2 eV, h = 4.136E-15 eV s
- Concept(s): E=hf
- Solution: f=E/h = (10.2 eV)/(4.136E-15 eV s) = 2.466e15 Hz
C. Wavelength:
- Find: λ
- Given: f = 2.466e15 Hz
- Concept(s): λ=c/f
- Solution: λ = (3E8 m/s)/(2.466E15 Hz) = 1.22E-7 m = 122 nm
D. Recall that visible light has wavelengths between about 400 and 700 nm. This wavelength is shorter, in the UV range.
Questions:
Calculate the (a) energies, (b) frequencies, (c) wavelengths, and (d) wavebands for other transitions in hydrogen.
1. What are your results for n=3 to n=1?
a. Energy:
eVShow your work:
b. Frequency:
HzShow your work:
c. Wavelength:
mShow your work:
d. Waveband: