6.9: Super-resolution
- Page ID
- 57631
\( \newcommand{\vecs}[1]{\overset { \scriptstyle \rightharpoonup} {\mathbf{#1}} } \)
\( \newcommand{\vecd}[1]{\overset{-\!-\!\rightharpoonup}{\vphantom{a}\smash {#1}}} \)
\( \newcommand{\dsum}{\displaystyle\sum\limits} \)
\( \newcommand{\dint}{\displaystyle\int\limits} \)
\( \newcommand{\dlim}{\displaystyle\lim\limits} \)
\( \newcommand{\id}{\mathrm{id}}\) \( \newcommand{\Span}{\mathrm{span}}\)
( \newcommand{\kernel}{\mathrm{null}\,}\) \( \newcommand{\range}{\mathrm{range}\,}\)
\( \newcommand{\RealPart}{\mathrm{Re}}\) \( \newcommand{\ImaginaryPart}{\mathrm{Im}}\)
\( \newcommand{\Argument}{\mathrm{Arg}}\) \( \newcommand{\norm}[1]{\| #1 \|}\)
\( \newcommand{\inner}[2]{\langle #1, #2 \rangle}\)
\( \newcommand{\Span}{\mathrm{span}}\)
\( \newcommand{\id}{\mathrm{id}}\)
\( \newcommand{\Span}{\mathrm{span}}\)
\( \newcommand{\kernel}{\mathrm{null}\,}\)
\( \newcommand{\range}{\mathrm{range}\,}\)
\( \newcommand{\RealPart}{\mathrm{Re}}\)
\( \newcommand{\ImaginaryPart}{\mathrm{Im}}\)
\( \newcommand{\Argument}{\mathrm{Arg}}\)
\( \newcommand{\norm}[1]{\| #1 \|}\)
\( \newcommand{\inner}[2]{\langle #1, #2 \rangle}\)
\( \newcommand{\Span}{\mathrm{span}}\) \( \newcommand{\AA}{\unicode[.8,0]{x212B}}\)
\( \newcommand{\vectorA}[1]{\vec{#1}} % arrow\)
\( \newcommand{\vectorAt}[1]{\vec{\text{#1}}} % arrow\)
\( \newcommand{\vectorB}[1]{\overset { \scriptstyle \rightharpoonup} {\mathbf{#1}} } \)
\( \newcommand{\vectorC}[1]{\textbf{#1}} \)
\( \newcommand{\vectorD}[1]{\overrightarrow{#1}} \)
\( \newcommand{\vectorDt}[1]{\overrightarrow{\text{#1}}} \)
\( \newcommand{\vectE}[1]{\overset{-\!-\!\rightharpoonup}{\vphantom{a}\smash{\mathbf {#1}}}} \)
\( \newcommand{\vecs}[1]{\overset { \scriptstyle \rightharpoonup} {\mathbf{#1}} } \)
\(\newcommand{\longvect}{\overrightarrow}\)
\( \newcommand{\vecd}[1]{\overset{-\!-\!\rightharpoonup}{\vphantom{a}\smash {#1}}} \)
\(\newcommand{\avec}{\mathbf a}\) \(\newcommand{\bvec}{\mathbf b}\) \(\newcommand{\cvec}{\mathbf c}\) \(\newcommand{\dvec}{\mathbf d}\) \(\newcommand{\dtil}{\widetilde{\mathbf d}}\) \(\newcommand{\evec}{\mathbf e}\) \(\newcommand{\fvec}{\mathbf f}\) \(\newcommand{\nvec}{\mathbf n}\) \(\newcommand{\pvec}{\mathbf p}\) \(\newcommand{\qvec}{\mathbf q}\) \(\newcommand{\svec}{\mathbf s}\) \(\newcommand{\tvec}{\mathbf t}\) \(\newcommand{\uvec}{\mathbf u}\) \(\newcommand{\vvec}{\mathbf v}\) \(\newcommand{\wvec}{\mathbf w}\) \(\newcommand{\xvec}{\mathbf x}\) \(\newcommand{\yvec}{\mathbf y}\) \(\newcommand{\zvec}{\mathbf z}\) \(\newcommand{\rvec}{\mathbf r}\) \(\newcommand{\mvec}{\mathbf m}\) \(\newcommand{\zerovec}{\mathbf 0}\) \(\newcommand{\onevec}{\mathbf 1}\) \(\newcommand{\real}{\mathbb R}\) \(\newcommand{\twovec}[2]{\left[\begin{array}{r}#1 \\ #2 \end{array}\right]}\) \(\newcommand{\ctwovec}[2]{\left[\begin{array}{c}#1 \\ #2 \end{array}\right]}\) \(\newcommand{\threevec}[3]{\left[\begin{array}{r}#1 \\ #2 \\ #3 \end{array}\right]}\) \(\newcommand{\cthreevec}[3]{\left[\begin{array}{c}#1 \\ #2 \\ #3 \end{array}\right]}\) \(\newcommand{\fourvec}[4]{\left[\begin{array}{r}#1 \\ #2 \\ #3 \\ #4 \end{array}\right]}\) \(\newcommand{\cfourvec}[4]{\left[\begin{array}{c}#1 \\ #2 \\ #3 \\ #4 \end{array}\right]}\) \(\newcommand{\fivevec}[5]{\left[\begin{array}{r}#1 \\ #2 \\ #3 \\ #4 \\ #5 \\ \end{array}\right]}\) \(\newcommand{\cfivevec}[5]{\left[\begin{array}{c}#1 \\ #2 \\ #3 \\ #4 \\ #5 \\ \end{array}\right]}\) \(\newcommand{\mattwo}[4]{\left[\begin{array}{rr}#1 \amp #2 \\ #3 \amp #4 \\ \end{array}\right]}\) \(\newcommand{\laspan}[1]{\text{Span}\{#1\}}\) \(\newcommand{\bcal}{\cal B}\) \(\newcommand{\ccal}{\cal C}\) \(\newcommand{\scal}{\cal S}\) \(\newcommand{\wcal}{\cal W}\) \(\newcommand{\ecal}{\cal E}\) \(\newcommand{\coords}[2]{\left\{#1\right\}_{#2}}\) \(\newcommand{\gray}[1]{\color{gray}{#1}}\) \(\newcommand{\lgray}[1]{\color{lightgray}{#1}}\) \(\newcommand{\rank}{\operatorname{rank}}\) \(\newcommand{\row}{\text{Row}}\) \(\newcommand{\col}{\text{Col}}\) \(\renewcommand{\row}{\text{Row}}\) \(\newcommand{\nul}{\text{Nul}}\) \(\newcommand{\var}{\text{Var}}\) \(\newcommand{\corr}{\text{corr}}\) \(\newcommand{\len}[1]{\left|#1\right|}\) \(\newcommand{\bbar}{\overline{\bvec}}\) \(\newcommand{\bhat}{\widehat{\bvec}}\) \(\newcommand{\bperp}{\bvec^\perp}\) \(\newcommand{\xhat}{\widehat{\xvec}}\) \(\newcommand{\vhat}{\widehat{\vvec}}\) \(\newcommand{\uhat}{\widehat{\uvec}}\) \(\newcommand{\what}{\widehat{\wvec}}\) \(\newcommand{\Sighat}{\widehat{\Sigma}}\) \(\newcommand{\lt}{<}\) \(\newcommand{\gt}{>}\) \(\newcommand{\amp}{&}\) \(\definecolor{fillinmathshade}{gray}{0.9}\)We have emphasised that evanescent waves set the ultimate limit to resolution in optics. In Chapter 2 it was explained that, although within geometrical optics one can image a single point perfectly using conical surfaces, several points, let alone an extended object, cannot be imaged perfectly. It was furthermore explained that when only paraxial rays are considered, i.e. within Gaussian geometrical optics, perfect imaging of extended objects is possible. However, rays of which the angle with the optical axis is large cause aberrations. But even when perfect imaging would be possible in geometrical optics, a real image can never be perfect due to the fact that information contained in the amplitudes and phase of the evanescent waves cannot propagate. The resolution that can be obtained with an optical system consisting of lenses is less than follows from considering the loss of information due to evanescent waves because also propagating waves with spatial frequencies that are too large to be captured by the optical system cannot contribute to the image. Therefore the image of a point object has the size \[\lambda / N A_{i} \nonumber \] where \(N A_{i}=a / s_{i}\) is the numerical aperture in image space, i.e. it is the sinus of half the opening angle of the cone extended by the exit pupil at the Gaussian image point on the optical axis. This resolution limit is called the diffraction limit.
The size of the image of a point as given by the PSF in (6.7.15) is influenced by the magnification of the system. To characterise the resolution of a diffraction-limited system, it is therefore better to consider the numerical aperture on the object side: \(N A_{o}=N A_{i}|M|=a / s_{o}\). The value of \(N A_{o}\) is the sinus of the half angle of the cone extended by the entrance pupil of the system on the object point on the optical axis. This is the cone of wave vectors emitted by this object point that can contribute to the image (they are "accepted" by the optical system). The larger the half angle of this cone, the higher the spatial frequencies that can contribute and hence information about finer details of the object is transmitted.
It should be clear by now that beating the diffraction limit is extremely difficult. Nevertheless, a lot of research in optics has been and still is directed towards realising this goal. Many attempts have been made, some successful, others not so, but, whether successful or not, most were based on very ingenious ideas. To close this chapter on diffraction theory, we will give examples of attempts to achieve what is called super-resolution.
- Confocal microscopy. A focused spot is used to scan the object and the reflected field is imaged onto a small detector ("point detector"). The resolution is roughly a factor \(1.5\) better than for normal imaging with full field of view using the same objective. The higher resolution is achieved thanks to the illumination by oblique plane waves that are present in the spatial (Fourier) spectrum of the illuminating spot. By illumination with plane waves under large angles of incidence, higher spatial frequencies of the object which are under normal incidence not accepted by the objective, are now "folded back" into the cone of plane waves accepted by the objective. The higher resolution comes at the prize of longer imaging time because of scanning. The confocal microscope was invented by Marvin Minsky in 1957 .
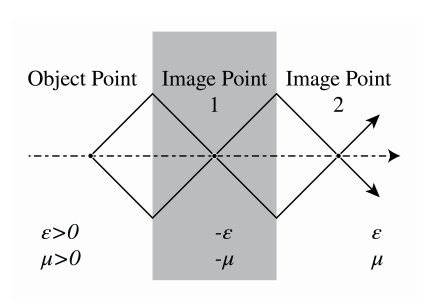
- The Perfect lens based on negative refraction. It can be shown that when a material has negative permittivity and negative permeability, the phase velocity of a plane wave is opposite to the energy velocity. Furthermore, when a slab of such material is surrounded by material with positive permittivity and positive permeability equal to the absolute values of the permittivity and permeability of the slab, the reflection of all waves is zero for every angle of incidence and every state of polarisation. Moreover, evanescent waves gain amplitude inside the slab and it turns out that there are two planes, one inside the slab and one on the other side of it, where a perfect image of a point in front of the slab occurs. Note that the increase of amplitude of an evanescent wave does not violate the conservation of energy, because an evanescent wave does not propagate energy in the direction in which it is evanescent. The simple slab geometry which acts as a perfect lens was proposed by John Pendry in \(2000\) and presented in Figure \(\PageIndex{1}\). Unfortunately, a material with negative permittivity and negative permeability has not been found in nature, although there seems to be no fundamental reason why it could not exist. Therefore, many researchers have attempted to mimic such a material using conventional materials such as metals. There are, however, more fundamental reasons why Pendry’s perfect lens will not work satisfactorily, even if the material would exist. We refer to the master course Advanced Photonics for more details.
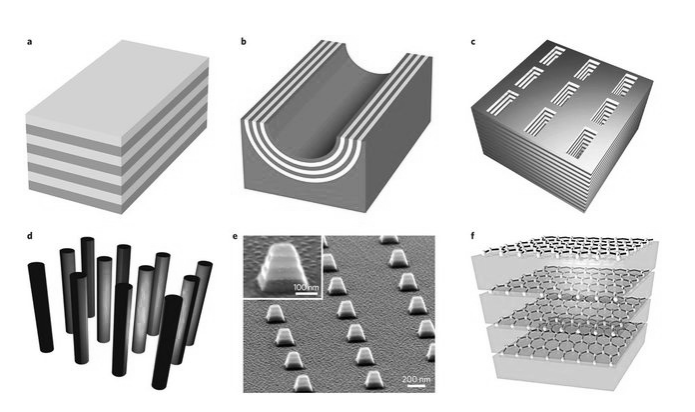
- Hyperbolic materials. Hyperbolic materials are anisotropic, i.e. the phase velocity of a plane wave depends on the polarisation and on the direction of the wave vector. The permittivity of an anisotropic material is a tensor (loosely speaking a (3,3)-matrix). Normally the eigenvalues of the permittivity matrix are positive; however, in a hyperbolic material two eigenvalues are of equal sign and the third has opposite sign. In such a medium all waves of the so-called extraordinary type of polarisation propagate, no matter how high the spatial frequencies are. Hence, for the extraordinary state of polarisation evanescent waves do not exist and therefore super-resolution and perfect imaging should be possible in such a medium. Natural hyperbolic media seem to exist for a few frequencies in the mid-infrared. For visible wavelengths, materials with hyperbolic behaviour are too lossy to give super-resolution. Therefore one tries to approximate hyperbolic media by so-called metamaterials which are made of very thin metallic and dielectric layers, so that the effective permittivity has the desired hyperbolic property. The success of this idea has, however, been moderate so far.
- Nonlinear effects. When the refractive index of a material depends on the local electric field, the material is nonlinear. At optical frequencies nonlinear effects are in general very small, but with a strong laser they can become significant. One effect is self-focusing, where the refractive index is proportional to the local light intensity. The locally higher intensity causes an increase of the refractive index, leading to a waveguiding effect due to which the beam focuses even more strongly. Hence the focused beam becomes more and more narrow while propagating, until finally the material breaks down.
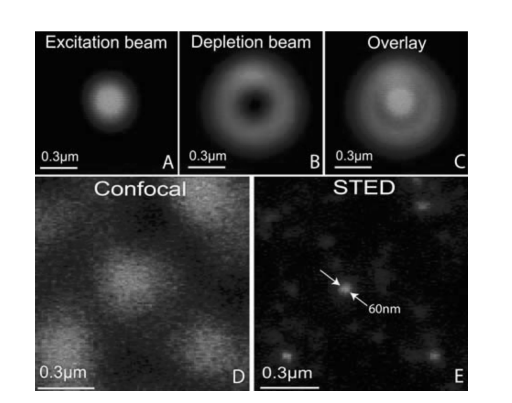
- Stimulated Emission Depletion Microscopy (STED). This technique was invented by V. A. Okhonin in 1986 in the USSR and was further developed by Stefan Hell and his co-workers in the nineties. Hell received the Nobel Prize in chemistry for his work in 2014. STED is a non-linear technique with which super-resolution in fluorescence microscopy can be achieved. Images made with a fluorescence microscope are blurred when the fluorescent molecules are very close together. In the STED microscope a special trick is used to ensure that fluorescing molecules are sufficiently distant from each other, so that they can be detected individually. To achieve this two focused spots are used: the first spot excites the molecules to a higher level. The second spot is slightly red-shifted and has a doughnut shape (see Figure \(\PageIndex{3}\)). It causes decay of the excited molecules to the lower level by stimulated emission (the excited state is depleted) Because of the doughnut shape of the second spot, the molecule in the centre of the spot is not affected and will still fluorescence. Crucial is that a doughnut spot has a central dark region which is very narrow i.e. it can be much smaller than the Airy spot and this is the reason for the super-resolution.
- Every picture is made of waves - Sixty Symbols, 3: 33 to 7:15: Basic explanation of Fourier transforms.
- Heisenberg’s Microscope - Sixty Symbols, 0:20 to 2:38: Basic explanation of the uncertainty principle (though in the context of quantum physics).
- E. Hecht, Optics, §7.4.4, subsection ’Fourier Analysis and Diffraction’.
- J. Goodman, Introduction to Fourier Optics, §5.2.2: Several calculations on the Fourier transforming properties of lenses.
- E. Hecht, Optics, \(\S 10.2 .6\), subsection ’Resolution of imaging systems’.